RBS 2010 Annual Report Download - page 79
Download and view the complete annual report
Please find page 79 of the 2010 RBS annual report below. You can navigate through the pages in the report by either clicking on the pages listed below, or by using the keyword search tool below to find specific information within the annual report.-
 1
1 -
2
-
3
-
4
-
5
-
6
-
7
-
8
-
9
-
10
-
11
-
12
-
13
-
14
-
15
-
16
-
17
-
18
-
19
-
20
-
21
-
22
-
23
-
24
-
25
-
26
-
27
-
28
-
29
-
30
-
31
-
32
-
33
-
34
-
35
-
36
-
37
-
38
-
39
-
40
-
41
-
42
-
43
-
44
-
45
-
46
-
47
-
48
-
49
-
50
-
51
-
52
-
53
-
54
-
55
-
56
-
57
-
58
-
59
-
60
-
61
-
62
-
63
-
64
-
65
-
66
-
67
-
68
-
 69
69 -
 70
70 -
 71
71 -
 72
72 -
 73
73 -
 74
74 -
 75
75 -
 76
76 -
 77
77 -
 78
78 -
 79
79 -
 80
80 -
 81
81 -
 82
82 -
 83
83 -
 84
84 -
 85
85 -
 86
86 -
 87
87 -
 88
88 -
 89
89 -
90
-
91
-
92
-
93
-
94
-
95
-
96
-
97
-
98
-
99
-
100
-
101
-
102
-
103
-
104
-
105
-
106
-
107
-
108
-
109
-
110
-
111
-
112
-
113
-
114
-
115
-
116
-
117
-
118
-
119
-
120
-
121
-
122
-
123
-
124
-
125
-
126
-
127
-
128
-
129
-
130
-
131
-
132
-
133
-
134
-
135
-
136
-
137
-
138
-
139
-
140
-
141
-
142
-
143
-
144
-
145
-
146
-
147
-
148
-
149
-
150
-
151
-
152
-
153
-
154
-
155
-
156
-
157
-
158
-
159
-
160
-
161
-
162
-
163
-
164
-
165
-
166
-
167
-
168
-
169
-
170
-
171
-
172
-
173
-
174
-
175
-
176
-
177
-
178
-
179
-
180
-
181
-
182
-
183
-
184
-
185
-
186
-
187
-
188
-
189
-
190
-
191
-
192
-
193
-
194
-
195
-
196
-
197
-
198
-
199
-
200
-
201
-
202
-
203
-
204
-
205
-
206
-
207
-
208
-
209
-
210
-
211
-
212
-
213
-
214
-
215
-
216
-
217
-
218
-
219
-
220
-
221
-
222
-
223
-
224
-
225
-
226
-
227
-
228
-
229
-
230
-
231
-
232
-
233
-
234
-
235
-
236
-
237
-
238
-
239
-
240
-
241
-
242
-
243
-
244
-
245
-
246
-
247
-
248
-
249
-
250
-
251
-
252
-
253
-
254
-
255
-
256
-
257
-
258
-
259
-
260
-
261
-
262
-
263
-
264
-
265
-
266
-
267
-
268
-
269
-
270
-
271
-
272
-
273
-
274
-
275
-
276
-
277
-
278
-
279
-
280
-
281
-
282
-
283
-
284
-
285
-
286
-
287
-
288
-
289
-
290
-
291
-
292
-
293
-
294
-
295
-
296
-
297
-
298
-
299
-
300
-
301
-
302
-
303
-
304
-
305
-
306
-
307
-
308
-
309
-
310
-
311
-
312
-
313
-
314
-
315
-
316
-
317
-
318
-
319
-
320
-
321
-
322
-
323
-
324
-
325
-
326
-
327
-
328
-
329
-
330
-
331
-
332
-
333
-
334
-
335
-
336
-
337
-
338
-
339
-
340
-
341
-
342
-
343
-
344
-
345
-
346
-
347
-
348
-
349
-
350
-
351
-
352
-
353
-
354
-
355
-
356
-
357
-
358
-
359
-
360
-
361
-
362
-
363
-
364
-
365
-
366
-
367
-
368
-
369
-
370
-
371
-
372
-
373
-
374
-
375
-
376
-
377
-
378
-
379
-
380
-
381
-
382
-
383
-
384
-
385
-
386
-
387
-
388
-
389
-
390
-
391
-
392
-
393
-
394
-
395
-
396
-
397
-
398
-
399
-
400
-
401
-
402
-
403
-
404
-
405
-
406
-
407
-
408
-
409
-
410
-
411
-
412
-
413
-
414
-
415
-
416
-
417
-
418
-
419
-
420
-
421
-
422
-
423
-
424
-
425
-
426
-
427
-
428
-
429
-
430
-
431
-
432
-
433
-
434
-
435
-
436
-
437
-
438
-
439
-
440
-
441
-
442
-
443
-
444
-
445
 |
 |

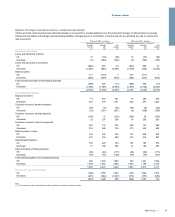
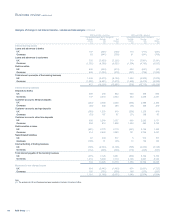
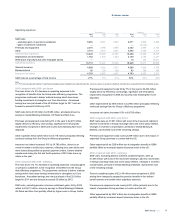
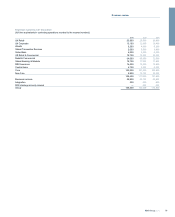
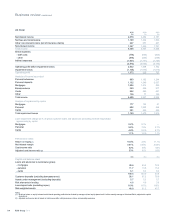
Divisional performance
The results of each division on a pro forma basis are set out below. The
results are stated before fair value of own debt, amortisation of
purchased intangible assets, integration and restructuring costs, gain on
redemption of own debt, strategic disposals, bonus tax, Asset Protection
Scheme credit default swap - fair value changes, gains on pensions
curtailment, write-down of goodwill and other intangible assets and RFS
Holdings minority interest.
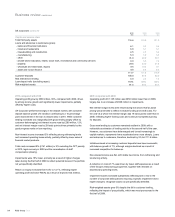
Business Services directly attributable costs have been allocated to the
operating divisions, based on their service usage. Where services span
more than one division an appropriate measure is used to allocate the
costs on a basis which management considers reasonable. Business
Services costs are fully allocated and there are no residual unallocated
costs.
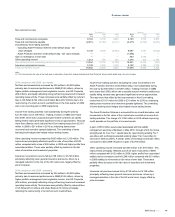
Group Centre directly attributable costs have been allocated to the
operating divisions, based on their service usage. Where services span
more than one division, the costs are allocated on a basis management
considers reasonable. The residual unallocated costs remaining in the
Group Centre relate to volatile corporate items that do not naturally reside
within a division.
Treasury costs are allocated to operating divisions as follows: term
funding costs are allocated or rewarded based on long term funding gap
or surplus; liquidity buffer funding costs are allocated based on share of
overall liquidity buffer derived from divisional stresses; and capital cost or
benefit is allocated based on share of divisional risk-adjusted risk-
weighted assets (RWAs).
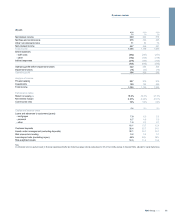
2010 2009 2008
£m £m £m
UK Retail 1,372 229 723
UK Corporate 1,463 1,125 1,781
Wealth 304 420 348
Global Transaction Services 1,088 973 1,002
Ulster Bank (761) (368) 218
US Retail & Commercial 306 (113) 528
Retail & Commercial 3,772 2,266 4,600
Global Banking & Markets 3,364 5,758 (2,153)
RBS Insurance (295) 58 584
Central items 577 385 150
Core 7,418 8,467 3,181
Non-Core (5,505) (14,557) (11,351)
Operating profit/(loss) before fair value of own debt 1,913 (6,090) (8,170)
Fair value of own debt 174 (142) 1,232
Operating profit/(loss) 2,087 (6,232) (6,938)
Amortisation of purchased intangible assets (369) (272) (443)
Integration and restructuring costs (1,032) (1,286) (1,357)
Gain on redemption of own debt 553 3,790 —
Strategic disposals 171 132 442
Gains on pensions curtailment —2,148 —
Bonus tax (99) (208) —
Asset Protection Scheme credit default swap - fair value changes (1,550) — —
Loss before tax (239) (1,928) (8,296)
77RBS Group 2010
Business review