RBS 2010 Annual Report Download - page 276
Download and view the complete annual report
Please find page 276 of the 2010 RBS annual report below. You can navigate through the pages in the report by either clicking on the pages listed below, or by using the keyword search tool below to find specific information within the annual report.-
 1
1 -
2
-
3
-
4
-
5
-
6
-
7
-
8
-
9
-
10
-
11
-
12
-
13
-
14
-
15
-
16
-
17
-
18
-
19
-
20
-
21
-
22
-
23
-
24
-
25
-
26
-
27
-
28
-
29
-
30
-
31
-
32
-
33
-
34
-
35
-
36
-
37
-
38
-
39
-
40
-
41
-
42
-
43
-
44
-
45
-
46
-
47
-
48
-
49
-
50
-
51
-
52
-
53
-
54
-
55
-
56
-
57
-
58
-
59
-
60
-
61
-
62
-
63
-
64
-
65
-
66
-
67
-
68
-
69
-
70
-
71
-
72
-
73
-
74
-
75
-
76
-
77
-
78
-
79
-
80
-
81
-
82
-
83
-
84
-
85
-
86
-
87
-
88
-
89
-
90
-
91
-
92
-
93
-
94
-
95
-
96
-
97
-
98
-
99
-
100
-
101
-
102
-
103
-
104
-
105
-
106
-
107
-
108
-
109
-
110
-
111
-
112
-
113
-
114
-
115
-
116
-
117
-
118
-
119
-
120
-
121
-
122
-
123
-
124
-
125
-
126
-
127
-
128
-
129
-
130
-
131
-
132
-
133
-
134
-
135
-
136
-
137
-
138
-
139
-
140
-
141
-
142
-
143
-
144
-
145
-
146
-
147
-
148
-
149
-
150
-
151
-
152
-
153
-
154
-
155
-
156
-
157
-
158
-
159
-
160
-
161
-
162
-
163
-
164
-
165
-
166
-
167
-
168
-
169
-
170
-
171
-
172
-
173
-
174
-
175
-
176
-
177
-
178
-
179
-
180
-
181
-
182
-
183
-
184
-
185
-
186
-
187
-
188
-
189
-
190
-
191
-
192
-
193
-
194
-
195
-
196
-
197
-
198
-
199
-
200
-
201
-
202
-
203
-
204
-
205
-
206
-
207
-
208
-
209
-
210
-
211
-
212
-
213
-
214
-
215
-
216
-
217
-
218
-
219
-
220
-
221
-
222
-
223
-
224
-
225
-
226
-
227
-
228
-
229
-
230
-
231
-
232
-
233
-
234
-
235
-
236
-
237
-
238
-
239
-
240
-
241
-
242
-
243
-
244
-
245
-
246
-
247
-
248
-
249
-
250
-
251
-
252
-
253
-
254
-
255
-
256
-
257
-
258
-
259
-
260
-
261
-
262
-
263
-
264
-
265
-
 266
266 -
 267
267 -
 268
268 -
 269
269 -
 270
270 -
 271
271 -
 272
272 -
 273
273 -
 274
274 -
 275
275 -
 276
276 -
 277
277 -
 278
278 -
 279
279 -
 280
280 -
 281
281 -
 282
282 -
 283
283 -
 284
284 -
 285
285 -
 286
286 -
287
-
288
-
289
-
290
-
291
-
292
-
293
-
294
-
295
-
296
-
297
-
298
-
299
-
300
-
301
-
302
-
303
-
304
-
305
-
306
-
307
-
308
-
309
-
310
-
311
-
312
-
313
-
314
-
315
-
316
-
317
-
318
-
319
-
320
-
321
-
322
-
323
-
324
-
325
-
326
-
327
-
328
-
329
-
330
-
331
-
332
-
333
-
334
-
335
-
336
-
337
-
338
-
339
-
340
-
341
-
342
-
343
-
344
-
345
-
346
-
347
-
348
-
349
-
350
-
351
-
352
-
353
-
354
-
355
-
356
-
357
-
358
-
359
-
360
-
361
-
362
-
363
-
364
-
365
-
366
-
367
-
368
-
369
-
370
-
371
-
372
-
373
-
374
-
375
-
376
-
377
-
378
-
379
-
380
-
381
-
382
-
383
-
384
-
385
-
386
-
387
-
388
-
389
-
390
-
391
-
392
-
393
-
394
-
395
-
396
-
397
-
398
-
399
-
400
-
401
-
402
-
403
-
404
-
405
-
406
-
407
-
408
-
409
-
410
-
411
-
412
-
413
-
414
-
415
-
416
-
417
-
418
-
419
-
420
-
421
-
422
-
423
-
424
-
425
-
426
-
427
-
428
-
429
-
430
-
431
-
432
-
433
-
434
-
435
-
436
-
437
-
438
-
439
-
440
-
441
-
442
-
443
-
444
-
445
 |
 |

Group Company
Note
2010
£m
2009
£m
2008
£m
2010
£m
2009
£m
2008
£m
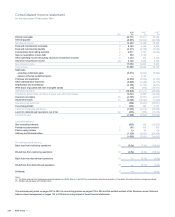
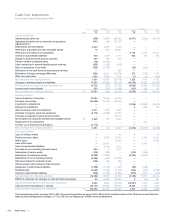
Operating activities
Operating loss before tax (399) (2,647) (25,691) (4,471) (1,286) (10,017)
Operating loss before tax on discontinued operations (541) (49) (10,937) ———
Adjustments for:
Depreciation and amortisation 2,220 2,809 3,154 ———
Write-down of goodwill and other intangible assets 10 363 32,581 ———
Write-down of investment in subsidiaries ——— 5,124 5,139 14,321
Interest on subordinated liabilities 500 1,490 2,144 462 537 499
Charge for defined benefit pension schemes 540 659 490 ———
Pension scheme curtailment gains (78) (2,148) — ———
Cash contribution to defined benefit pension schemes (832) (1,153) (810) ———
Gain on redemption of own debt (553) (3,790) — (53) (238) —
Elimination of non-cash items on discontinued activities —— 592 ———
Elimination of foreign exchange differences (691) 12,217 (41,874) 272 (753) 1,778
Other non-cash items 1,455 7,940 8,772 (1) 20 (478)
Net cash flows from trading activities 1,631 15,691 (31,579) 1,333 3,419 6,103
Changes in operating assets and liabilities 17,095 (15,964) (42,219) (10,238) 12,537 (22,254)
Net cash flows from operating activities before tax 18,726 (273) (73,798) (8,905) 15,956 (16,151)
Income taxes received/(paid) 565 (719) (1,540) (133) 409 119
Net cash flows from operating activities 35 19,291 (992) (75,338) (9,038) 16,365 (16,032)
Investing activities
Sale and maturity of securities 47,604 76,492 53,390 ———
Purchase of securities (43,485) (73,593) (55,229) ———
Investment in subsidiaries ——— (1,884) (23,902) (10,349)
Disposal of subsidiaries ——— 67,908 700
Sale of property, plant and equipment 2,011 1,948 2,228 ———
Purchase of property, plant and equipment (2,113) (4,898) (5,757) ———
Proceeds on disposal of discontinued activities —— 20,113 ———
Net investment in business interests and intangible assets 36 3,446 105 2,252 ———
Repayments from subsidiaries ——— —274 —
Transfer out of discontinued operations (4,112) —— ———
Net cash flows from investing activities 3,351 54 16,997 (1,878) (15,720) (9,649)
Financing activities
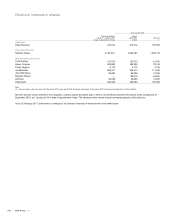
Issue of ordinary shares 1— 49 1— 49
Placing and open offers —5,274 19,741 —5,274 19,741
Rights issue —— 12,000 —— 12,000
Issue of B shares —25,101 — —12,801 —
Issue of subordinated liabilities —2,309 2,413 ———
Proceeds of non-controlling interests issued 559 9 1,427 ———
Redemption of paid-in equity (132) (308) — (132) (308) —
Redemption of preference shares (2,359) (5,000) — (2,352) (5,000) —
Redemption of non-controlling interests (5,282) (422) (13,579) ———
Shares purchased by employee trusts (700) (33) (64) ———
Shares issued under employee share schemes ——2 ———
Repayment of subordinated liabilities (1,588) (5,145) (1,727) (98) (458) —
Dividends paid (4,240) (1,248) (3,193) (124) (935) (2,908)
Interest on subordinated liabilities (639) (1,746) (1,967) (475) (557) (466)
Net cash flows from financing activities (14,380) 18,791 15,102 (3,180) 10,817 28,416
Effects of exchange rate changes on cash and cash equivalents 82 (8,592) 29,209 5(83) 761
Net increase/(decrease) in cash and cash equivalents 8,344 9,261 (14,030) (14,091) 11,379 3,496
Cash and cash equivalents at 1 January 144,186 134,925 148,955 16,448 5,069 1,573
Cash and cash equivalents at 31 December 39 152,530 144,186 134,925 2,357 16,448 5,069
The accompanying notes on pages 287 to 385, the accounting policies on pages 275 to 286 and the audited sections of the Business review: Risk and
balance sheet management on pages to 119 to 224 form an integral part of these financial statements.
RBS Group 2010274
Cash flow statements
for the year ended 31 December 2010