RBS 2010 Annual Report Download - page 95
Download and view the complete annual report
Please find page 95 of the 2010 RBS annual report below. You can navigate through the pages in the report by either clicking on the pages listed below, or by using the keyword search tool below to find specific information within the annual report.-
 1
1 -
2
-
3
-
4
-
5
-
6
-
7
-
8
-
9
-
10
-
11
-
12
-
13
-
14
-
15
-
16
-
17
-
18
-
19
-
20
-
21
-
22
-
23
-
24
-
25
-
26
-
27
-
28
-
29
-
30
-
31
-
32
-
33
-
34
-
35
-
36
-
37
-
38
-
39
-
40
-
41
-
42
-
43
-
44
-
45
-
46
-
47
-
48
-
49
-
50
-
51
-
52
-
53
-
54
-
55
-
56
-
57
-
58
-
59
-
60
-
61
-
62
-
63
-
64
-
65
-
66
-
67
-
68
-
69
-
70
-
71
-
72
-
73
-
74
-
75
-
76
-
77
-
78
-
79
-
80
-
81
-
82
-
83
-
84
-
 85
85 -
 86
86 -
 87
87 -
 88
88 -
 89
89 -
 90
90 -
 91
91 -
 92
92 -
 93
93 -
 94
94 -
 95
95 -
 96
96 -
 97
97 -
 98
98 -
 99
99 -
 100
100 -
 101
101 -
 102
102 -
 103
103 -
 104
104 -
 105
105 -
106
-
107
-
108
-
109
-
110
-
111
-
112
-
113
-
114
-
115
-
116
-
117
-
118
-
119
-
120
-
121
-
122
-
123
-
124
-
125
-
126
-
127
-
128
-
129
-
130
-
131
-
132
-
133
-
134
-
135
-
136
-
137
-
138
-
139
-
140
-
141
-
142
-
143
-
144
-
145
-
146
-
147
-
148
-
149
-
150
-
151
-
152
-
153
-
154
-
155
-
156
-
157
-
158
-
159
-
160
-
161
-
162
-
163
-
164
-
165
-
166
-
167
-
168
-
169
-
170
-
171
-
172
-
173
-
174
-
175
-
176
-
177
-
178
-
179
-
180
-
181
-
182
-
183
-
184
-
185
-
186
-
187
-
188
-
189
-
190
-
191
-
192
-
193
-
194
-
195
-
196
-
197
-
198
-
199
-
200
-
201
-
202
-
203
-
204
-
205
-
206
-
207
-
208
-
209
-
210
-
211
-
212
-
213
-
214
-
215
-
216
-
217
-
218
-
219
-
220
-
221
-
222
-
223
-
224
-
225
-
226
-
227
-
228
-
229
-
230
-
231
-
232
-
233
-
234
-
235
-
236
-
237
-
238
-
239
-
240
-
241
-
242
-
243
-
244
-
245
-
246
-
247
-
248
-
249
-
250
-
251
-
252
-
253
-
254
-
255
-
256
-
257
-
258
-
259
-
260
-
261
-
262
-
263
-
264
-
265
-
266
-
267
-
268
-
269
-
270
-
271
-
272
-
273
-
274
-
275
-
276
-
277
-
278
-
279
-
280
-
281
-
282
-
283
-
284
-
285
-
286
-
287
-
288
-
289
-
290
-
291
-
292
-
293
-
294
-
295
-
296
-
297
-
298
-
299
-
300
-
301
-
302
-
303
-
304
-
305
-
306
-
307
-
308
-
309
-
310
-
311
-
312
-
313
-
314
-
315
-
316
-
317
-
318
-
319
-
320
-
321
-
322
-
323
-
324
-
325
-
326
-
327
-
328
-
329
-
330
-
331
-
332
-
333
-
334
-
335
-
336
-
337
-
338
-
339
-
340
-
341
-
342
-
343
-
344
-
345
-
346
-
347
-
348
-
349
-
350
-
351
-
352
-
353
-
354
-
355
-
356
-
357
-
358
-
359
-
360
-
361
-
362
-
363
-
364
-
365
-
366
-
367
-
368
-
369
-
370
-
371
-
372
-
373
-
374
-
375
-
376
-
377
-
378
-
379
-
380
-
381
-
382
-
383
-
384
-
385
-
386
-
387
-
388
-
389
-
390
-
391
-
392
-
393
-
394
-
395
-
396
-
397
-
398
-
399
-
400
-
401
-
402
-
403
-
404
-
405
-
406
-
407
-
408
-
409
-
410
-
411
-
412
-
413
-
414
-
415
-
416
-
417
-
418
-
419
-
420
-
421
-
422
-
423
-
424
-
425
-
426
-
427
-
428
-
429
-
430
-
431
-
432
-
433
-
434
-
435
-
436
-
437
-
438
-
439
-
440
-
441
-
442
-
443
-
444
-
445
 |
 |

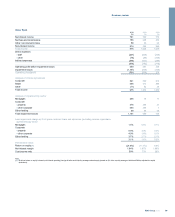
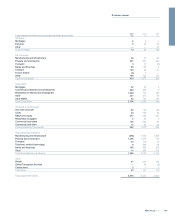
2010 2009 2008 2010 2009 2008
US$bn US$bn US$bn £bn £bn £bn
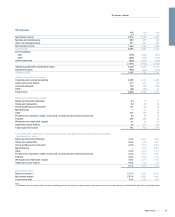
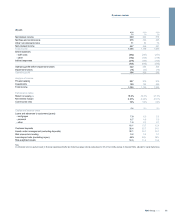
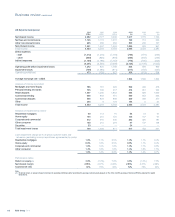
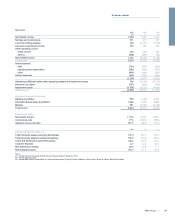
Capital and balance sheet
Total third party assets 110.5 122.3 129.5 71.2 75.4 88.7
Loans and advances to customers (gross)
-residential mortgages 9.4 10.6 13.9 6.1 6.5 9.5
- home equity 23.6 25.0 27.2 15.2 15.4 18.7
- corporate and commercial 31.7 31.6 34.7 20.4 19.5 23.8
- other consumer 10.6 12.1 14.3 6.9 7.5 9.8
75.3 79.3 90.1 48.6 48.9 61.8
Customer deposits (excluding repos) 91.2 97.4 93.4 58.7 60.1 63.9
Risk elements in lending
-retail 0.7 0.6 0.3 0.4 0.4 0.2
- commercial 0.7 0.4 0.2 0.5 0.2 0.2
1.4 1.0 0.5 0.9 0.6 0.4
Loan:deposit ratio (excluding repos) 81% 80% 96% 81% 80% 96%
Risk-weighted assets 88.4 96.9 93.2 57.0 59.7 63.9
Spot exchange rate - US$/£ 1.552 1.622 1.460
2010 compared with 2009
Operating profit of $473 million represented a marked improvement from
an operating loss of $174 million with income up 7%, expenses down 2%
and impairment losses down 27%.
Net interest income was up 7%, despite a smaller balance sheet, with net
interest margin improving by 48 basis points to 2.85%.
Non-interest income was up 7% reflecting higher mortgage banking and
debit card income, commercial banking fees and higher gains on
securities realisations. This was partially offset by lower deposit fees
which were impacted by Regulation E legislative changes in 2010. In
addition, gains of $330 million were recognised on the sale of available-
for-sale securities as part of the balance sheet restructuring exercise, but
these were almost wholly offset by losses crystallised on the termination
of swaps hedging fixed-rate funding.
Total expenses were down 2%, reflecting a $113 million credit related to
changes to the defined benefit pension plan, and lower Federal Deposit
Insurance Corporation (FDIC) deposit insurance levies, partially offset by
the impact of changing rates on the valuation of mortgage servicing rights
and litigation costs.
Impairment losses declined 27%, following significant loan reserve
building in 2009 and a gradual improvement in the underlying credit
environment, offset by higher impairments related to securities. Loan
impairments as a percentage of loans and advances decreased from
1.4% to 1.0%.
2009 compared with 2008
The recessionary economic environment, historically low interest rates
and deteriorating credit conditions resulted in an operating loss of $174
million. However, the business has now successfully refocused on its
core customer franchises in New England, the Mid-Atlantic region and the
Midwest.
The division achieved very strong growth in mortgage origination
volumes, with significantly higher penetration through the branch network
and improved profitability, particularly on recent origination vintages.
Cross-selling of card, deposit and checking account products has
increased substantially, with over 65% of new mortgage customers also
taking out a checking account. The division has also increased
commercial banking market penetration, with lead bank share within its
footprint increasing from 6% to 7% in the $5 million to $25 million
segment and from 6% to 8% in the $25 million to $500 million segment.
Net interest income was down 13%. Net interest margin was down 31
basis points for the full year, reflecting the decline in deposit margins
resulting from the low interest rate environment, though margins have
been partially rebuilt in the second half from the lows experienced in the
first half, as the business repriced lending rates and aggressively reduced
pricing on term and time deposits.
Expenses increased by 11%, reflecting increased FDIC deposit insurance
levies, higher employee benefit costs as well as increased costs relating
to loan workout and collection activity. Successful execution of
restructuring activities resulted in approximately $75 million of cost
savings.
Impairment losses increased to $1,099 million as loan impairments as a
percentage of loans and advances increased from 0.9% to 1.4%.
Loans and advances were down 12%, reflecting subdued customer
demand.
Customer deposits increased 4% from the prior year. The deposit mix
improved significantly, with strong growth in checking balances combined
with migration away from higher priced term and time deposits as the
division adjusted its pricing strategies. Over 58,000 consumer checking
accounts were added over the course of the year, and more than 13,000
small business checking accounts. Consumer checking balances grew by
8% and small business balances by 12%.
93RBS Group 2010
Business review