RBS 2010 Annual Report Download - page 146
Download and view the complete annual report
Please find page 146 of the 2010 RBS annual report below. You can navigate through the pages in the report by either clicking on the pages listed below, or by using the keyword search tool below to find specific information within the annual report.-
 1
1 -
2
-
3
-
4
-
5
-
6
-
7
-
8
-
9
-
10
-
11
-
12
-
13
-
14
-
15
-
16
-
17
-
18
-
19
-
20
-
21
-
22
-
23
-
24
-
25
-
26
-
27
-
28
-
29
-
30
-
31
-
32
-
33
-
34
-
35
-
36
-
37
-
38
-
39
-
40
-
41
-
42
-
43
-
44
-
45
-
46
-
47
-
48
-
49
-
50
-
51
-
52
-
53
-
54
-
55
-
56
-
57
-
58
-
59
-
60
-
61
-
62
-
63
-
64
-
65
-
66
-
67
-
68
-
69
-
70
-
71
-
72
-
73
-
74
-
75
-
76
-
77
-
78
-
79
-
80
-
81
-
82
-
83
-
84
-
85
-
86
-
87
-
88
-
89
-
90
-
91
-
92
-
93
-
94
-
95
-
96
-
97
-
98
-
99
-
100
-
101
-
102
-
103
-
104
-
105
-
106
-
107
-
108
-
109
-
110
-
111
-
112
-
113
-
114
-
115
-
116
-
117
-
118
-
119
-
120
-
121
-
122
-
123
-
124
-
125
-
126
-
127
-
128
-
129
-
130
-
131
-
132
-
133
-
134
-
135
-
 136
136 -
 137
137 -
 138
138 -
 139
139 -
 140
140 -
 141
141 -
 142
142 -
 143
143 -
 144
144 -
 145
145 -
 146
146 -
 147
147 -
 148
148 -
 149
149 -
 150
150 -
 151
151 -
 152
152 -
 153
153 -
 154
154 -
 155
155 -
 156
156 -
157
-
158
-
159
-
160
-
161
-
162
-
163
-
164
-
165
-
166
-
167
-
168
-
169
-
170
-
171
-
172
-
173
-
174
-
175
-
176
-
177
-
178
-
179
-
180
-
181
-
182
-
183
-
184
-
185
-
186
-
187
-
188
-
189
-
190
-
191
-
192
-
193
-
194
-
195
-
196
-
197
-
198
-
199
-
200
-
201
-
202
-
203
-
204
-
205
-
206
-
207
-
208
-
209
-
210
-
211
-
212
-
213
-
214
-
215
-
216
-
217
-
218
-
219
-
220
-
221
-
222
-
223
-
224
-
225
-
226
-
227
-
228
-
229
-
230
-
231
-
232
-
233
-
234
-
235
-
236
-
237
-
238
-
239
-
240
-
241
-
242
-
243
-
244
-
245
-
246
-
247
-
248
-
249
-
250
-
251
-
252
-
253
-
254
-
255
-
256
-
257
-
258
-
259
-
260
-
261
-
262
-
263
-
264
-
265
-
266
-
267
-
268
-
269
-
270
-
271
-
272
-
273
-
274
-
275
-
276
-
277
-
278
-
279
-
280
-
281
-
282
-
283
-
284
-
285
-
286
-
287
-
288
-
289
-
290
-
291
-
292
-
293
-
294
-
295
-
296
-
297
-
298
-
299
-
300
-
301
-
302
-
303
-
304
-
305
-
306
-
307
-
308
-
309
-
310
-
311
-
312
-
313
-
314
-
315
-
316
-
317
-
318
-
319
-
320
-
321
-
322
-
323
-
324
-
325
-
326
-
327
-
328
-
329
-
330
-
331
-
332
-
333
-
334
-
335
-
336
-
337
-
338
-
339
-
340
-
341
-
342
-
343
-
344
-
345
-
346
-
347
-
348
-
349
-
350
-
351
-
352
-
353
-
354
-
355
-
356
-
357
-
358
-
359
-
360
-
361
-
362
-
363
-
364
-
365
-
366
-
367
-
368
-
369
-
370
-
371
-
372
-
373
-
374
-
375
-
376
-
377
-
378
-
379
-
380
-
381
-
382
-
383
-
384
-
385
-
386
-
387
-
388
-
389
-
390
-
391
-
392
-
393
-
394
-
395
-
396
-
397
-
398
-
399
-
400
-
401
-
402
-
403
-
404
-
405
-
406
-
407
-
408
-
409
-
410
-
411
-
412
-
413
-
414
-
415
-
416
-
417
-
418
-
419
-
420
-
421
-
422
-
423
-
424
-
425
-
426
-
427
-
428
-
429
-
430
-
431
-
432
-
433
-
434
-
435
-
436
-
437
-
438
-
439
-
440
-
441
-
442
-
443
-
444
-
445
 |
 |

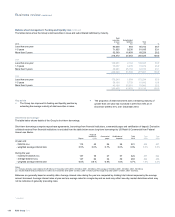
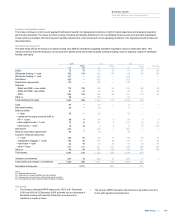
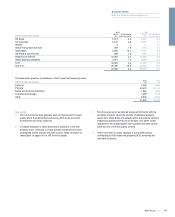
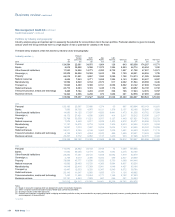
Balance sheet management: Sensitivity of net interest income*
The Group seeks to mitigate the effect of prospective interest rate
movements which could reduce future net interest income through the
movement of market rates in the Group’s retail and commercial
businesses, whilst balancing the cost of such hedging activities on the
current net revenue stream. Hedging activities also consider the impact
on market value sensitivity under stress.
The following table shows the sensitivity of net interest income over the
next twelve months to an immediate up and down 100 basis points
change to all interest rates. In addition the table includes a 100 basis
points steepening and flattening of the yield curves over a one year
horizon.
2010 2009 2008
£m £m £m
+100bp shift in yield curves 232 510 139
-100bp shift in yield curves (352) (687) (234)
Steepener (30)
Flattener (22)
Key points
xThe Group executed transactions in 2010 to reduce the exposure to rising rates related to capital raised in December 2009.
xActions taken during the year increased the current base level of net interest income, while reducing the Group’s overall asset sensitivity.
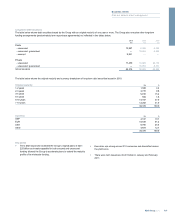
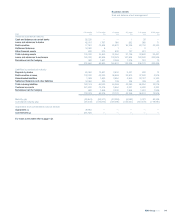
Structural foreign currency exposures
Structural foreign exchange exposures represent net investment in
subsidiaries, associates and branches, the functional currencies of which
are currencies other than sterling. The Group hedges structural foreign
exchange exposures only in limited circumstances. The Group’s objective
is to ensure, where practical, that its consolidated capital ratios are
largely protected from the effect of changes in exchange rates.
The Group seeks to limit the sensitivity to its Core Tier 1 ratio to 20 basis
points in a 10% rate shock scenario. The Group’s structural foreign
exchange position is reviewed by GALCO regularly.
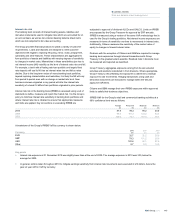
The table below sets out the Group's structural foreign exchange
exposures.
Net
assets of
overseas
operations
RFS
Holdings
minority
interest
Net
investments
in foreign
operations
Net
investment
hedges
Structural
foreign
currency
exposures
pre-economic
hedges
Economic
hedges (1)
Residual
structural
foreign
currency
exposures
2010 £m £m £m £m £m £m £m
US dollar 17,137 2 17,135 (1,820) 15,315 (4,058) 11,257
Euro 8,443 33 8,410 (578) 7,832 (2,305) 5,527
Other non-sterling 5,320 244 5,076 (4,135) 941 — 941
30,900 279 30,621 (6,533) 24,088 (6,363) 17,725
2009
US dollar 15,589 (2) 15,591 (3,846) 11,745 (5,696) 6,049
Euro 21,900 13,938 7,962 (2,351) 5,611 (3,522) 2,089
Other non-sterling 5,706 511 5,195 (4,001) 1,194 — 1,194
43,195 14,447 28,748 (10,198) 18,550 (9,218) 9,332
2008
US dollar 17,480 (19) 17,499 (3,659) 13,840 (7,806) 6,034
Euro 26,943 15,431 11,512 (7,461) 4,051 (4,109) (58)
Chinese Renminbi 3,928 1,898 2,030 (1,082) 948 — 948
Brazilian Real 5,088 621 4,467 (3,096) 1,371 — 1,371
53,439 17,931 35,508 (15,298) 20,210 (11,915) 8,295
Note:
(1) The economic hedges represent US dollar and euro preference shares in issue that are treated as equity under IFRS, and do not qualify as hedges for accounting purposes.
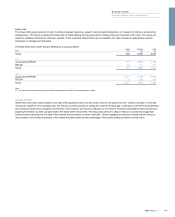
Key points
xChanges in foreign currency exchange rates will affect equity in
proportion to the structural foreign currency exposure. A 5%
strengthening in foreign currencies against sterling would result in a
gain of £1,200 million (2009 - £930 million; 2008 - £1,010 million)
recognised in equity, while a 5% weakening in foreign currencies
would result in a loss of £1,150 million (2009 - £880 million; 2008 -
£960 million) recognised in equity.
xStructural foreign currency exposures have increased in sterling
terms due to exchange rate movements and reduced hedging. The
increased exposures more effectively offset retranslation
movements in RWAs, reducing the sensitivity of the Group’s capital
ratios to exchange rate movements.
*unaudited
RBS Group 2010144
Business review continued