RBS 2010 Annual Report Download - page 179
Download and view the complete annual report
Please find page 179 of the 2010 RBS annual report below. You can navigate through the pages in the report by either clicking on the pages listed below, or by using the keyword search tool below to find specific information within the annual report.-
 1
1 -
2
-
3
-
4
-
5
-
6
-
7
-
8
-
9
-
10
-
11
-
12
-
13
-
14
-
15
-
16
-
17
-
18
-
19
-
20
-
21
-
22
-
23
-
24
-
25
-
26
-
27
-
28
-
29
-
30
-
31
-
32
-
33
-
34
-
35
-
36
-
37
-
38
-
39
-
40
-
41
-
42
-
43
-
44
-
45
-
46
-
47
-
48
-
49
-
50
-
51
-
52
-
53
-
54
-
55
-
56
-
57
-
58
-
59
-
60
-
61
-
62
-
63
-
64
-
65
-
66
-
67
-
68
-
69
-
70
-
71
-
72
-
73
-
74
-
75
-
76
-
77
-
78
-
79
-
80
-
81
-
82
-
83
-
84
-
85
-
86
-
87
-
88
-
89
-
90
-
91
-
92
-
93
-
94
-
95
-
96
-
97
-
98
-
99
-
100
-
101
-
102
-
103
-
104
-
105
-
106
-
107
-
108
-
109
-
110
-
111
-
112
-
113
-
114
-
115
-
116
-
117
-
118
-
119
-
120
-
121
-
122
-
123
-
124
-
125
-
126
-
127
-
128
-
129
-
130
-
131
-
132
-
133
-
134
-
135
-
136
-
137
-
138
-
139
-
140
-
141
-
142
-
143
-
144
-
145
-
146
-
147
-
148
-
149
-
150
-
151
-
152
-
153
-
154
-
155
-
156
-
157
-
158
-
159
-
160
-
161
-
162
-
163
-
164
-
165
-
166
-
167
-
168
-
 169
169 -
 170
170 -
 171
171 -
 172
172 -
 173
173 -
 174
174 -
 175
175 -
 176
176 -
 177
177 -
 178
178 -
 179
179 -
 180
180 -
 181
181 -
 182
182 -
 183
183 -
 184
184 -
 185
185 -
 186
186 -
 187
187 -
 188
188 -
 189
189 -
190
-
191
-
192
-
193
-
194
-
195
-
196
-
197
-
198
-
199
-
200
-
201
-
202
-
203
-
204
-
205
-
206
-
207
-
208
-
209
-
210
-
211
-
212
-
213
-
214
-
215
-
216
-
217
-
218
-
219
-
220
-
221
-
222
-
223
-
224
-
225
-
226
-
227
-
228
-
229
-
230
-
231
-
232
-
233
-
234
-
235
-
236
-
237
-
238
-
239
-
240
-
241
-
242
-
243
-
244
-
245
-
246
-
247
-
248
-
249
-
250
-
251
-
252
-
253
-
254
-
255
-
256
-
257
-
258
-
259
-
260
-
261
-
262
-
263
-
264
-
265
-
266
-
267
-
268
-
269
-
270
-
271
-
272
-
273
-
274
-
275
-
276
-
277
-
278
-
279
-
280
-
281
-
282
-
283
-
284
-
285
-
286
-
287
-
288
-
289
-
290
-
291
-
292
-
293
-
294
-
295
-
296
-
297
-
298
-
299
-
300
-
301
-
302
-
303
-
304
-
305
-
306
-
307
-
308
-
309
-
310
-
311
-
312
-
313
-
314
-
315
-
316
-
317
-
318
-
319
-
320
-
321
-
322
-
323
-
324
-
325
-
326
-
327
-
328
-
329
-
330
-
331
-
332
-
333
-
334
-
335
-
336
-
337
-
338
-
339
-
340
-
341
-
342
-
343
-
344
-
345
-
346
-
347
-
348
-
349
-
350
-
351
-
352
-
353
-
354
-
355
-
356
-
357
-
358
-
359
-
360
-
361
-
362
-
363
-
364
-
365
-
366
-
367
-
368
-
369
-
370
-
371
-
372
-
373
-
374
-
375
-
376
-
377
-
378
-
379
-
380
-
381
-
382
-
383
-
384
-
385
-
386
-
387
-
388
-
389
-
390
-
391
-
392
-
393
-
394
-
395
-
396
-
397
-
398
-
399
-
400
-
401
-
402
-
403
-
404
-
405
-
406
-
407
-
408
-
409
-
410
-
411
-
412
-
413
-
414
-
415
-
416
-
417
-
418
-
419
-
420
-
421
-
422
-
423
-
424
-
425
-
426
-
427
-
428
-
429
-
430
-
431
-
432
-
433
-
434
-
435
-
436
-
437
-
438
-
439
-
440
-
441
-
442
-
443
-
444
-
445
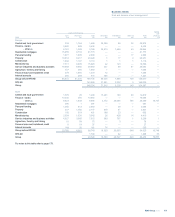
 |
 |

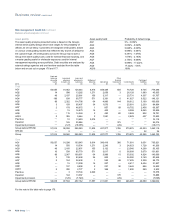
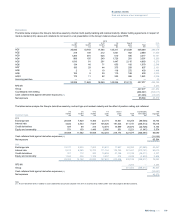
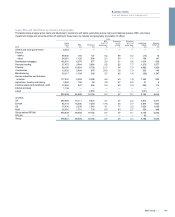
Central and local government
2009
UK
£m
US
£m
Other
£m
Banks and
building
societies
£m
ABS (1)
£m
Corporate
£m
Other
£m
Total
£m %of total (2)
AAA 26,601 23,219 44,396 4,012 65,067 2,263 — 165,558 66
AA to AA+ — — 22,003 4,930 8,942 1,429 — 37,304 15
Ato AA- — — 13,159 3,770 3,886 1,860 — 22,675 9
BBB- to A- — — 3,847 823 4,243 2,187 — 11,100 5
Non-investment grade — — 353 169 3,515 2,042 — 6,079 2
Unrated — — 504 289 1,949 2,601 1,036 6,379 3
Group before RFS MI 26,601 23,219 84,262 13,993 87,602 12,382 1,036 249,095 100
RFS MI 721 183 11,871 3,803 580 906 95 18,159
Group 27,322 23,402 96,133 17,796 88,182 13,288 1,131 267,254
2008
AAA 18,787 16,514 43,197 8,126 93,853 3,953 — 184,430 73
BBB- to AA+ — — 15,862 13,013 11,437 10,172 — 50,484 20
Non-investment grade — — 242 127 3,678 2,259 — 6,306 2
Unrated — — 409 1,445 2,175 4,517 3,393 11,939 5
Group before RFS MI 18,787 16,514 59,710 22,711 111,143 20,901 3,393 253,159 100
RFS MI — 7 10,761 1,652 — 885 1,085 14,390
Group 18,787 16,521 70,471 24,363 111,143 21,786 4,478 267,549
Notes:
(1) Asset-backed securities.
(2) Percentage calculated on Group before RFS MI.
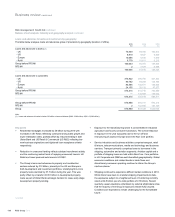
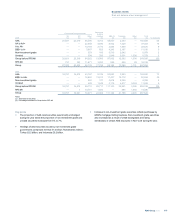
Key points
xThe proportion of AAA rated securities was broadly unchanged
during the year whilst the proportion of non-investment grade and
unrated securities increased from 5% to 7%.
xHoldings of debt securities issued by non-investment grade
governments comprised: Greece £1.0 billion; Romania £0.3 billion;
Turkey £0.2 billion; and Indonesia £0.2 billion.
xIncrease in non-investment grade securities reflects purchases by
GBM’s mortgage trading business. Non-investment grade securities
also increased as a result of credit downgrades and rating
withdrawals of certain ABS structures in Non-Core during the year.
177RBS Group 2010
Business review
Risk and balance sheet management