RBS 2010 Annual Report Download - page 199
Download and view the complete annual report
Please find page 199 of the 2010 RBS annual report below. You can navigate through the pages in the report by either clicking on the pages listed below, or by using the keyword search tool below to find specific information within the annual report.-
 1
1 -
2
-
3
-
4
-
5
-
6
-
7
-
8
-
9
-
10
-
11
-
12
-
13
-
14
-
15
-
16
-
17
-
18
-
19
-
20
-
21
-
22
-
23
-
24
-
25
-
26
-
27
-
28
-
29
-
30
-
31
-
32
-
33
-
34
-
35
-
36
-
37
-
38
-
39
-
40
-
41
-
42
-
43
-
44
-
45
-
46
-
47
-
48
-
49
-
50
-
51
-
52
-
53
-
54
-
55
-
56
-
57
-
58
-
59
-
60
-
61
-
62
-
63
-
64
-
65
-
66
-
67
-
68
-
69
-
70
-
71
-
72
-
73
-
74
-
75
-
76
-
77
-
78
-
79
-
80
-
81
-
82
-
83
-
84
-
85
-
86
-
87
-
88
-
89
-
90
-
91
-
92
-
93
-
94
-
95
-
96
-
97
-
98
-
99
-
100
-
101
-
102
-
103
-
104
-
105
-
106
-
107
-
108
-
109
-
110
-
111
-
112
-
113
-
114
-
115
-
116
-
117
-
118
-
119
-
120
-
121
-
122
-
123
-
124
-
125
-
126
-
127
-
128
-
129
-
130
-
131
-
132
-
133
-
134
-
135
-
136
-
137
-
138
-
139
-
140
-
141
-
142
-
143
-
144
-
145
-
146
-
147
-
148
-
149
-
150
-
151
-
152
-
153
-
154
-
155
-
156
-
157
-
158
-
159
-
160
-
161
-
162
-
163
-
164
-
165
-
166
-
167
-
168
-
169
-
170
-
171
-
172
-
173
-
174
-
175
-
176
-
177
-
178
-
179
-
180
-
181
-
182
-
183
-
184
-
185
-
186
-
187
-
188
-
 189
189 -
 190
190 -
 191
191 -
 192
192 -
 193
193 -
 194
194 -
 195
195 -
 196
196 -
 197
197 -
 198
198 -
 199
199 -
 200
200 -
 201
201 -
 202
202 -
 203
203 -
 204
204 -
 205
205 -
 206
206 -
 207
207 -
 208
208 -
 209
209 -
210
-
211
-
212
-
213
-
214
-
215
-
216
-
217
-
218
-
219
-
220
-
221
-
222
-
223
-
224
-
225
-
226
-
227
-
228
-
229
-
230
-
231
-
232
-
233
-
234
-
235
-
236
-
237
-
238
-
239
-
240
-
241
-
242
-
243
-
244
-
245
-
246
-
247
-
248
-
249
-
250
-
251
-
252
-
253
-
254
-
255
-
256
-
257
-
258
-
259
-
260
-
261
-
262
-
263
-
264
-
265
-
266
-
267
-
268
-
269
-
270
-
271
-
272
-
273
-
274
-
275
-
276
-
277
-
278
-
279
-
280
-
281
-
282
-
283
-
284
-
285
-
286
-
287
-
288
-
289
-
290
-
291
-
292
-
293
-
294
-
295
-
296
-
297
-
298
-
299
-
300
-
301
-
302
-
303
-
304
-
305
-
306
-
307
-
308
-
309
-
310
-
311
-
312
-
313
-
314
-
315
-
316
-
317
-
318
-
319
-
320
-
321
-
322
-
323
-
324
-
325
-
326
-
327
-
328
-
329
-
330
-
331
-
332
-
333
-
334
-
335
-
336
-
337
-
338
-
339
-
340
-
341
-
342
-
343
-
344
-
345
-
346
-
347
-
348
-
349
-
350
-
351
-
352
-
353
-
354
-
355
-
356
-
357
-
358
-
359
-
360
-
361
-
362
-
363
-
364
-
365
-
366
-
367
-
368
-
369
-
370
-
371
-
372
-
373
-
374
-
375
-
376
-
377
-
378
-
379
-
380
-
381
-
382
-
383
-
384
-
385
-
386
-
387
-
388
-
389
-
390
-
391
-
392
-
393
-
394
-
395
-
396
-
397
-
398
-
399
-
400
-
401
-
402
-
403
-
404
-
405
-
406
-
407
-
408
-
409
-
410
-
411
-
412
-
413
-
414
-
415
-
416
-
417
-
418
-
419
-
420
-
421
-
422
-
423
-
424
-
425
-
426
-
427
-
428
-
429
-
430
-
431
-
432
-
433
-
434
-
435
-
436
-
437
-
438
-
439
-
440
-
441
-
442
-
443
-
444
-
445
 |
 |

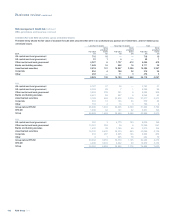
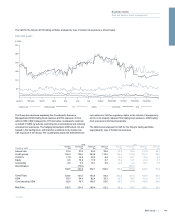
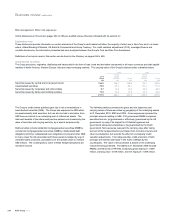
Non-traded portfolios
VaR is not always the most appropriate measure of risk for assets in the
non-trading book, particularly for those in Non-Core which will diminish
over time as the asset inventory is sold down.
In order to better represent the risk of the non-traded portfolios, the table
below analyses the VaR for the non-trading portfolios but excludes
Structured Credit Portfolios (SCP) in Non-Core. These assets are shown
separately on a drawn notional and fair value basis by maturity profile
and asset class and are managed on both an asset and RWA basis.
Also excluded from the non-traded VaR are the loans and receivables
products that are managed within the credit risk management framework.
The 2009 and 2010 VaR data below is shown on this basis; however the
VaR data for the 2008 period could not be recalculated excluding the
SCP and LAR portfolios mentioned above due to data and system
constraints.
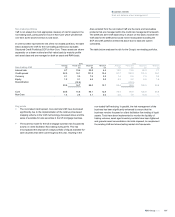
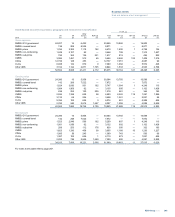
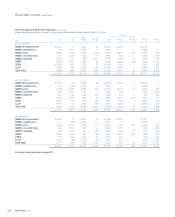
The table below analyses the risk for the Group’s non-trading portfolios.
2010 2009
Non-trading VaR Average
£m
Period end
£m
Maximum
£m
Minimum
£m
Average
£m
Period end
£m
Maximum
£m
Minimum
£m
Interest rate 8.7 10.4 20.5 4.4 13.0 13.9 26.3 7.7
Credit spread 32.0 16.1 101.2 15.4 81.7 100.3 131.5 39.7
Currency 2.1 3.0 7.6 0.3
1.4 0.6 7.0 0.2
Equity 1.2 3.1 4.6 0.2
3.3 2.2 5.8 1.6
Diversification (15.9) (20.4)
30.9 16.7 98.0 13.7 80.4 96.6 126.9 46.8
Core 30.5 15.6 98.1 12.8
78.4 95.9 126.9 46.8
Non-Core 1.3 2.8 4.1 0.2
3.5 1.9 16.9 —
Key points
xThe non-traded credit spread, Core and total VaR have decreased
significantly due to the implementation of the relative price-based
mapping scheme in the VaR methodology discussed above and the
sales of available-for-sale securities in the US mortgage business.
xThe business model for the US mortgage business has focussed its
activity on client facilitation flow trading during 2010. This has
encompassed the disposal of a large portfolio of illiquid available-for-
sale securities that were sold throughout the year, resulting in the
non-traded VaR reducing. In parallel, the risk management of the
business has been significantly enhanced to ensure that the
business remains focussed on client facilitation flow trading of liquid
assets. Tools have been implemented to monitor the liquidity of
trading volumes, asset aged inventory controls have been tightened
and granular asset concentration risk limits imposed, to complement
the existing VaR and stress testing market risk frameworks.
197RBS Group 2010
Business review
Risk and balance sheet management