RBS 2010 Annual Report Download - page 78
Download and view the complete annual report
Please find page 78 of the 2010 RBS annual report below. You can navigate through the pages in the report by either clicking on the pages listed below, or by using the keyword search tool below to find specific information within the annual report.-
 1
1 -
2
-
3
-
4
-
5
-
6
-
7
-
8
-
9
-
10
-
11
-
12
-
13
-
14
-
15
-
16
-
17
-
18
-
19
-
20
-
21
-
22
-
23
-
24
-
25
-
26
-
27
-
28
-
29
-
30
-
31
-
32
-
33
-
34
-
35
-
36
-
37
-
38
-
39
-
40
-
41
-
42
-
43
-
44
-
45
-
46
-
47
-
48
-
49
-
50
-
51
-
52
-
53
-
54
-
55
-
56
-
57
-
58
-
59
-
60
-
61
-
62
-
63
-
64
-
65
-
66
-
67
-
 68
68 -
 69
69 -
 70
70 -
 71
71 -
 72
72 -
 73
73 -
 74
74 -
 75
75 -
 76
76 -
 77
77 -
 78
78 -
 79
79 -
 80
80 -
 81
81 -
 82
82 -
 83
83 -
 84
84 -
 85
85 -
 86
86 -
 87
87 -
 88
88 -
89
-
90
-
91
-
92
-
93
-
94
-
95
-
96
-
97
-
98
-
99
-
100
-
101
-
102
-
103
-
104
-
105
-
106
-
107
-
108
-
109
-
110
-
111
-
112
-
113
-
114
-
115
-
116
-
117
-
118
-
119
-
120
-
121
-
122
-
123
-
124
-
125
-
126
-
127
-
128
-
129
-
130
-
131
-
132
-
133
-
134
-
135
-
136
-
137
-
138
-
139
-
140
-
141
-
142
-
143
-
144
-
145
-
146
-
147
-
148
-
149
-
150
-
151
-
152
-
153
-
154
-
155
-
156
-
157
-
158
-
159
-
160
-
161
-
162
-
163
-
164
-
165
-
166
-
167
-
168
-
169
-
170
-
171
-
172
-
173
-
174
-
175
-
176
-
177
-
178
-
179
-
180
-
181
-
182
-
183
-
184
-
185
-
186
-
187
-
188
-
189
-
190
-
191
-
192
-
193
-
194
-
195
-
196
-
197
-
198
-
199
-
200
-
201
-
202
-
203
-
204
-
205
-
206
-
207
-
208
-
209
-
210
-
211
-
212
-
213
-
214
-
215
-
216
-
217
-
218
-
219
-
220
-
221
-
222
-
223
-
224
-
225
-
226
-
227
-
228
-
229
-
230
-
231
-
232
-
233
-
234
-
235
-
236
-
237
-
238
-
239
-
240
-
241
-
242
-
243
-
244
-
245
-
246
-
247
-
248
-
249
-
250
-
251
-
252
-
253
-
254
-
255
-
256
-
257
-
258
-
259
-
260
-
261
-
262
-
263
-
264
-
265
-
266
-
267
-
268
-
269
-
270
-
271
-
272
-
273
-
274
-
275
-
276
-
277
-
278
-
279
-
280
-
281
-
282
-
283
-
284
-
285
-
286
-
287
-
288
-
289
-
290
-
291
-
292
-
293
-
294
-
295
-
296
-
297
-
298
-
299
-
300
-
301
-
302
-
303
-
304
-
305
-
306
-
307
-
308
-
309
-
310
-
311
-
312
-
313
-
314
-
315
-
316
-
317
-
318
-
319
-
320
-
321
-
322
-
323
-
324
-
325
-
326
-
327
-
328
-
329
-
330
-
331
-
332
-
333
-
334
-
335
-
336
-
337
-
338
-
339
-
340
-
341
-
342
-
343
-
344
-
345
-
346
-
347
-
348
-
349
-
350
-
351
-
352
-
353
-
354
-
355
-
356
-
357
-
358
-
359
-
360
-
361
-
362
-
363
-
364
-
365
-
366
-
367
-
368
-
369
-
370
-
371
-
372
-
373
-
374
-
375
-
376
-
377
-
378
-
379
-
380
-
381
-
382
-
383
-
384
-
385
-
386
-
387
-
388
-
389
-
390
-
391
-
392
-
393
-
394
-
395
-
396
-
397
-
398
-
399
-
400
-
401
-
402
-
403
-
404
-
405
-
406
-
407
-
408
-
409
-
410
-
411
-
412
-
413
-
414
-
415
-
416
-
417
-
418
-
419
-
420
-
421
-
422
-
423
-
424
-
425
-
426
-
427
-
428
-
429
-
430
-
431
-
432
-
433
-
434
-
435
-
436
-
437
-
438
-
439
-
440
-
441
-
442
-
443
-
444
-
445
 |
 |

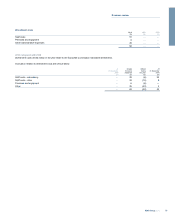
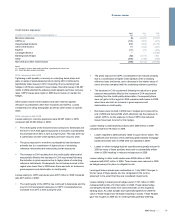
Credit market exposures continued
Additional disclosures on these and other related exposures can be found in the following sections:
Disclosure Section Sub-section Page
Further analysis of credit market exposures Risk and balance sheet management Other risk exposures 204
Valuation aspects Financial statements Note 12 Financial instruments - valuation 310
Financial statements Critical accounting policies 284
Reclassification of financial instruments Financial statements Note 11 Financial instruments - classification 306
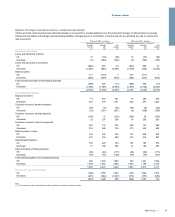
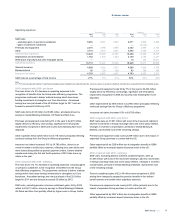
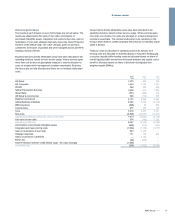
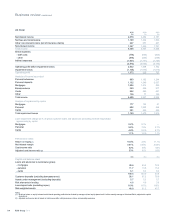
Tax
Pro forma Statutory
2010 2009 2008 2010 2009 2008
£m £m £m £m £m £m
Tax (charge)/credit (663) 339 1,280
(634) 429 2,167
%% % %% %
UK corporation tax rate 28.0 28.0 28.5
28.0 28.0 28.5
Effective tax rate nm 17.6 15.4
nm 16.2 8.4
nm = not meaningful
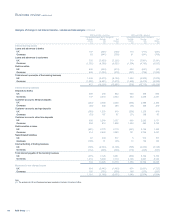
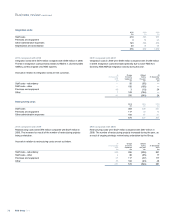
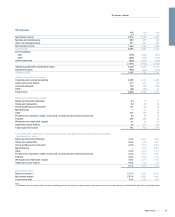
The actual tax (charge)/credit differs from the expected tax credit computed by applying the standard rate of UK corporation tax as follows:
Pro forma Statutory
2010 2009 2008 2010 2009 2008
£m £m £m £m £m £m
Expected tax credit 67 540 2,364
112 741 7,322
Non-deductible goodwill impairment —— — (3) (102) (3,826)
Unrecognised timing differences 11 274 (274) 11 274 (274)
Items not allowed for tax
-losses on strategic disposals and write downs (299) (152) (108) (311) (152) (108)
- other (328) (356) (263) (328) (356) (270)
Non-taxable items
-gain on sale of Global Merchant Services 221 — — 221 — —
- gain on redemption of own debt 11 693 —
11 693 —
- other 341 410 491
341 410 491
Taxable foreign exchange movements 41 (80) 41 (80)
Foreign profits taxed at other rates (516) (332) (271) (517) (276) (509)
UK tax rate change - deferred tax impact (82) — — (82) — —
Losses in year where no deferred tax asset recognised (450) (715) (942) (450) (780) (942)
Losses brought forward and utilised 294 11
294 11
Adjustments in respect of prior years 355 (118) 352 355 (118) 352
Actual tax (charge)/credit (663) 339 1,280
(634) 429 2,167
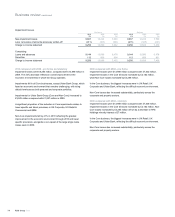
2010 compared with 2009 - pro forma
The high taxcharge in 2010 reflects profits in high tax regimes and
losses in low tax regimes, together with £450 million relating to losses in
overseas subsidiaries for which a deferred tax asset has not been
recognised, and £299 million mainly in respect of losses on disposal of
businesses for which no tax relief if available. This was offset in part by
the non-taxable gain arising on the disposal of 80.01% of the Global
Merchant Services (GMS) business.
2009 compared with 2008 - pro forma
The lowtax credit in 2009 reflects profits in high tax regimes and losses
in low tax regimes, together with £715 million relating to losses in
overseas subsidiaries for which a deferred tax asset has not been
recognised, and £152 million mainly in respect of losses on disposal of
businesses for which no tax relief is available.
2010 compared with 2009 - statutory
The high taxcharge in 2010 reflects profits in high tax regimes and
losses in low tax regimes, together with £450 million relating to losses in
overseas subsidiaries for which a deferred tax asset has not been
recognised, and £311 million mainly in respect of losses on disposal of
businesses for which no tax relief is available. This was offset in part by
the non-taxable gain arising on the disposal of 80.01% of the GMS
business.
2009 compared with 2008 - statutory
The lowtax credit in 2009 reflects profits in high tax regimes and losses
in low tax regimes, together with £780 million relating to losses in
overseas subsidiaries for which a deferred tax asset has not been
recognised, and £152 million mainly in respect of losses on disposal of
business for which no tax relief is available.
RBS Group 201076
Business review continued