RBS 2010 Annual Report Download - page 8
Download and view the complete annual report
Please find page 8 of the 2010 RBS annual report below. You can navigate through the pages in the report by either clicking on the pages listed below, or by using the keyword search tool below to find specific information within the annual report.-
 1
1 -
 2
2 -
 3
3 -
 4
4 -
 5
5 -
 6
6 -
 7
7 -
 8
8 -
 9
9 -
 10
10 -
 11
11 -
 12
12 -
 13
13 -
 14
14 -
 15
15 -
 16
16 -
 17
17 -
 18
18 -
 19
19 -
20
-
21
-
22
-
23
-
24
-
25
-
26
-
27
-
28
-
29
-
30
-
31
-
32
-
33
-
34
-
35
-
36
-
37
-
38
-
39
-
40
-
41
-
42
-
43
-
44
-
45
-
46
-
47
-
48
-
49
-
50
-
51
-
52
-
53
-
54
-
55
-
56
-
57
-
58
-
59
-
60
-
61
-
62
-
63
-
64
-
65
-
66
-
67
-
68
-
69
-
70
-
71
-
72
-
73
-
74
-
75
-
76
-
77
-
78
-
79
-
80
-
81
-
82
-
83
-
84
-
85
-
86
-
87
-
88
-
89
-
90
-
91
-
92
-
93
-
94
-
95
-
96
-
97
-
98
-
99
-
100
-
101
-
102
-
103
-
104
-
105
-
106
-
107
-
108
-
109
-
110
-
111
-
112
-
113
-
114
-
115
-
116
-
117
-
118
-
119
-
120
-
121
-
122
-
123
-
124
-
125
-
126
-
127
-
128
-
129
-
130
-
131
-
132
-
133
-
134
-
135
-
136
-
137
-
138
-
139
-
140
-
141
-
142
-
143
-
144
-
145
-
146
-
147
-
148
-
149
-
150
-
151
-
152
-
153
-
154
-
155
-
156
-
157
-
158
-
159
-
160
-
161
-
162
-
163
-
164
-
165
-
166
-
167
-
168
-
169
-
170
-
171
-
172
-
173
-
174
-
175
-
176
-
177
-
178
-
179
-
180
-
181
-
182
-
183
-
184
-
185
-
186
-
187
-
188
-
189
-
190
-
191
-
192
-
193
-
194
-
195
-
196
-
197
-
198
-
199
-
200
-
201
-
202
-
203
-
204
-
205
-
206
-
207
-
208
-
209
-
210
-
211
-
212
-
213
-
214
-
215
-
216
-
217
-
218
-
219
-
220
-
221
-
222
-
223
-
224
-
225
-
226
-
227
-
228
-
229
-
230
-
231
-
232
-
233
-
234
-
235
-
236
-
237
-
238
-
239
-
240
-
241
-
242
-
243
-
244
-
245
-
246
-
247
-
248
-
249
-
250
-
251
-
252
-
253
-
254
-
255
-
256
-
257
-
258
-
259
-
260
-
261
-
262
-
263
-
264
-
265
-
266
-
267
-
268
-
269
-
270
-
271
-
272
-
273
-
274
-
275
-
276
-
277
-
278
-
279
-
280
-
281
-
282
-
283
-
284
-
285
-
286
-
287
-
288
-
289
-
290
-
291
-
292
-
293
-
294
-
295
-
296
-
297
-
298
-
299
-
300
-
301
-
302
-
303
-
304
-
305
-
306
-
307
-
308
-
309
-
310
-
311
-
312
-
313
-
314
-
315
-
316
-
317
-
318
-
319
-
320
-
321
-
322
-
323
-
324
-
325
-
326
-
327
-
328
-
329
-
330
-
331
-
332
-
333
-
334
-
335
-
336
-
337
-
338
-
339
-
340
-
341
-
342
-
343
-
344
-
345
-
346
-
347
-
348
-
349
-
350
-
351
-
352
-
353
-
354
-
355
-
356
-
357
-
358
-
359
-
360
-
361
-
362
-
363
-
364
-
365
-
366
-
367
-
368
-
369
-
370
-
371
-
372
-
373
-
374
-
375
-
376
-
377
-
378
-
379
-
380
-
381
-
382
-
383
-
384
-
385
-
386
-
387
-
388
-
389
-
390
-
391
-
392
-
393
-
394
-
395
-
396
-
397
-
398
-
399
-
400
-
401
-
402
-
403
-
404
-
405
-
406
-
407
-
408
-
409
-
410
-
411
-
412
-
413
-
414
-
415
-
416
-
417
-
418
-
419
-
420
-
421
-
422
-
423
-
424
-
425
-
426
-
427
-
428
-
429
-
430
-
431
-
432
-
433
-
434
-
435
-
436
-
437
-
438
-
439
-
440
-
441
-
442
-
443
-
444
-
445
 |
 |

RBS Group 20106
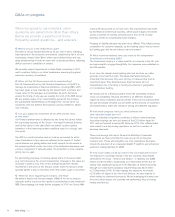
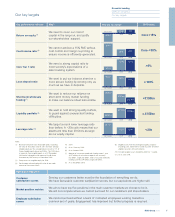
Q&As on progress
When we speak to our investors, some
questions are asked more often than others.
Below we provide a selection of those
frequently asked questions – and answers.
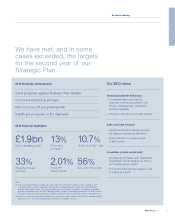
xWhere are you in the impairment cycle?
The level of Group impairments fell by 33 per cent in 2010, reflecting
improvements in the economic environment. Impairments fell in all core
businesses, except Ulster Bank, where asset default levels and loss
rates remained high in both the retail and corporate portfolios, reflecting
difficult economic conditions in Ireland.
We currently expect impairments in Ulster Bank to stabilise in 2011,
and to continue falling in our other businesses, assuming the global
economic recovery is sustained.
xWhen will the UK Government sell its shareholding?
The UK Government set up UK Financial Investments Ltd (UKFI) to
manage its investments in financial institutions, including RBS. UKFI
has been given a clear mandate by the Government, to protect and
create value for the taxpayer as shareholder. As such, decisions
around the timing of any sale are outside the remit of the RBS Group.
We are acutely aware of our responsibility as part of this process.
By successfully implementing our Strategic Plan, we will serve our
customers well and achieve the business success needed to attract
new investors.
xCan you explain the treatment of the APS and fair value
of own debt?
Our financial performance is affected by two items that do not reflect
the day-to-day business of the Group – the Asset Protection Scheme
and the fair value of own debt. Both can exhibit counter-cyclical
behaviour, in that improving market conditions result in a charge, and
vice versa.
The APS is a credit derivative and so must be accounted for at fair
value; fluctuations in this value are reflected in the results. If market
circumstances are getting better and credit spreads for the assets in
the covered portfolio narrow, the value of the protection decreases and
a loss is recognised. If spreads widen, the protection is more valuable,
giving rise to a gain.
For accounting purposes, the Group values some of its issued debt
(e.g. bond issues) at the current market price. Changes in this value are
recorded in profit or loss. Part of this change results from market
movements in the price of the Group’s credit: when the Group’s credit
spreads tighten a loss is recorded, when they widen a gain is recorded.
xWhat has been happening to margins, and why?
We need to rebuild net interest margins (NIMs) if we are to produce
adequate profits to service the capital our shareholders have invested in
RBS. Encouragingly, we made further progress in 2010: the Group NIM
rose by 25 basis points to 2.01 per cent. This improvement was driven
by the Retail & Commercial business, where asset margins recovered
across a number of markets, primarily due to the run-off of older
business written at unsustainably lower margins.
Progress on liability margins has been more difficult. This reflects strong
competition for customer deposits, as the banking sector tries to narrow
its funding gap, and the low interest rate environment.
xWhat recommendations have you made to the Independent
Commission on Banking (ICB)?
The Commission inquiry is a major event for our industry in the UK, and
we have sought to engage thoughtfully. Our response was published on
the ICB website.
In our view, the debate about banking size and structure can often
generate more heat than light. The banks that failed during the
crisis didn’t fail because they were too big, or because they had an
investment bank. They failed because they had some form of
concentration risk: in funding, in lending to property, in geography
or in proprietary trading.
We should aim for a financial system where the probability of future
crises is substantially reduced and there is an effective resolution
regime for those institutions that do still fail. If this can be achieved then
the size and shape of banks can be driven by the choices of customers
and shareholders, within the context of strong and effective regulation.
xHow much progress have you made towards the
cost reduction target you set?
Our cost reduction programme continues to deliver material savings.
Annualised savings are now just ahead of the £2.5 billion target for
2011 and are forecast to exceed £3 billion by 2013. This reflects better
cost control in our day-to-day operations, as well as a number of
business disposals.
These cost savings will help to finance the £6 billion of essential
investments we have committed to make as part of our five-year
recovery plan. These will strengthen our core businesses. Examples
include the provision of an integrated Wealth IT platform and enhanced
electronic trading facilities for GBM.
xHow much exposure do you have to the sovereign debt crisis?
Our exposure to sovereign bonds in the two countries most deeply
embroiled in the crisis – Greece and Ireland – is relatively low (£895
million and £104 million, respectively at 31 December 2010). But we
clearly have significant exposure to the Republic of Ireland economy
through our Ulster Bank subsidiary (total lending was £43.2 billion
at 31 December 2010). To help manage this exposure, we placed
c.£15 billion of assets in our Non-Core Division, the vast majority of
which relates to commercial property. We are managing this down over
time and, where assets are currently non-performing, they are being
heavily provisioned.