RBS 2010 Annual Report Download - page 128
Download and view the complete annual report
Please find page 128 of the 2010 RBS annual report below. You can navigate through the pages in the report by either clicking on the pages listed below, or by using the keyword search tool below to find specific information within the annual report.-
 1
1 -
2
-
3
-
4
-
5
-
6
-
7
-
8
-
9
-
10
-
11
-
12
-
13
-
14
-
15
-
16
-
17
-
18
-
19
-
20
-
21
-
22
-
23
-
24
-
25
-
26
-
27
-
28
-
29
-
30
-
31
-
32
-
33
-
34
-
35
-
36
-
37
-
38
-
39
-
40
-
41
-
42
-
43
-
44
-
45
-
46
-
47
-
48
-
49
-
50
-
51
-
52
-
53
-
54
-
55
-
56
-
57
-
58
-
59
-
60
-
61
-
62
-
63
-
64
-
65
-
66
-
67
-
68
-
69
-
70
-
71
-
72
-
73
-
74
-
75
-
76
-
77
-
78
-
79
-
80
-
81
-
82
-
83
-
84
-
85
-
86
-
87
-
88
-
89
-
90
-
91
-
92
-
93
-
94
-
95
-
96
-
97
-
98
-
99
-
100
-
101
-
102
-
103
-
104
-
105
-
106
-
107
-
108
-
109
-
110
-
111
-
112
-
113
-
114
-
115
-
116
-
117
-
 118
118 -
 119
119 -
 120
120 -
 121
121 -
 122
122 -
 123
123 -
 124
124 -
 125
125 -
 126
126 -
 127
127 -
 128
128 -
 129
129 -
 130
130 -
 131
131 -
 132
132 -
 133
133 -
 134
134 -
 135
135 -
 136
136 -
 137
137 -
 138
138 -
139
-
140
-
141
-
142
-
143
-
144
-
145
-
146
-
147
-
148
-
149
-
150
-
151
-
152
-
153
-
154
-
155
-
156
-
157
-
158
-
159
-
160
-
161
-
162
-
163
-
164
-
165
-
166
-
167
-
168
-
169
-
170
-
171
-
172
-
173
-
174
-
175
-
176
-
177
-
178
-
179
-
180
-
181
-
182
-
183
-
184
-
185
-
186
-
187
-
188
-
189
-
190
-
191
-
192
-
193
-
194
-
195
-
196
-
197
-
198
-
199
-
200
-
201
-
202
-
203
-
204
-
205
-
206
-
207
-
208
-
209
-
210
-
211
-
212
-
213
-
214
-
215
-
216
-
217
-
218
-
219
-
220
-
221
-
222
-
223
-
224
-
225
-
226
-
227
-
228
-
229
-
230
-
231
-
232
-
233
-
234
-
235
-
236
-
237
-
238
-
239
-
240
-
241
-
242
-
243
-
244
-
245
-
246
-
247
-
248
-
249
-
250
-
251
-
252
-
253
-
254
-
255
-
256
-
257
-
258
-
259
-
260
-
261
-
262
-
263
-
264
-
265
-
266
-
267
-
268
-
269
-
270
-
271
-
272
-
273
-
274
-
275
-
276
-
277
-
278
-
279
-
280
-
281
-
282
-
283
-
284
-
285
-
286
-
287
-
288
-
289
-
290
-
291
-
292
-
293
-
294
-
295
-
296
-
297
-
298
-
299
-
300
-
301
-
302
-
303
-
304
-
305
-
306
-
307
-
308
-
309
-
310
-
311
-
312
-
313
-
314
-
315
-
316
-
317
-
318
-
319
-
320
-
321
-
322
-
323
-
324
-
325
-
326
-
327
-
328
-
329
-
330
-
331
-
332
-
333
-
334
-
335
-
336
-
337
-
338
-
339
-
340
-
341
-
342
-
343
-
344
-
345
-
346
-
347
-
348
-
349
-
350
-
351
-
352
-
353
-
354
-
355
-
356
-
357
-
358
-
359
-
360
-
361
-
362
-
363
-
364
-
365
-
366
-
367
-
368
-
369
-
370
-
371
-
372
-
373
-
374
-
375
-
376
-
377
-
378
-
379
-
380
-
381
-
382
-
383
-
384
-
385
-
386
-
387
-
388
-
389
-
390
-
391
-
392
-
393
-
394
-
395
-
396
-
397
-
398
-
399
-
400
-
401
-
402
-
403
-
404
-
405
-
406
-
407
-
408
-
409
-
410
-
411
-
412
-
413
-
414
-
415
-
416
-
417
-
418
-
419
-
420
-
421
-
422
-
423
-
424
-
425
-
426
-
427
-
428
-
429
-
430
-
431
-
432
-
433
-
434
-
435
-
436
-
437
-
438
-
439
-
440
-
441
-
442
-
443
-
444
-
445
 |
 |

Balance sheet management
All the disclosures in this section (pages 126 to 145) are audited unless
otherwise indicated by an asterisk (*).
Capital*
It is the Group’s policy to maintain a strong capital base and to utilise it
efficiently throughout its activities to optimise the return to shareholders,
while maintaining a prudent relationship between the capital base and the
underlying risks of the business. In carrying out this policy, the Group has
regard to the supervisory requirements of the FSA.
Group Treasury in conjunction with the divisions and Risk Management,
in respect of risk-weighted assets (RWAs), manage and control the
Group’s balance sheet risks and consequent impact on the Group’s
capital, funding, liquidity, interest rate and currency risks.
The FSA uses risk asset ratio (RAR) as a measure of capital adequacy in
the UK banking sector, comparing a bank’s capital resources with its
RWAs (the assets and off-balance sheet exposures are weighted to
reflect the inherent credit and other risks); by international agreement the
RAR should be not less than 8% with a Tier 1 component of not less than
4%.
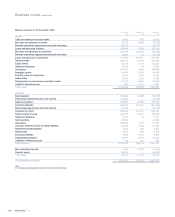
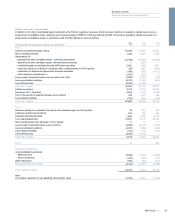
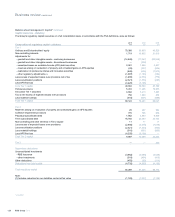
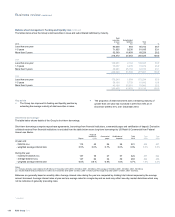
Proportional Statutory
Risk-weighted assets 2010
£bn
2009
£bn
2008
£bn
2010
£bn
2009
£bn
2008
£bn
Credit risk 383.0 410.4 433.4
385.9 513.2 551.3
Counterparty risk 68.1 56.5 61.1
68.1 56.5 61.1
Market risk 80.0 65.0 46.5
80.0 65.0 46.5
Operational risk 37.1 33.9 36.8
37.1 33.9 36.9
568.2 565.8 577.8
571.1 668.6 695.8
Asset Protection Scheme relief (105.6) (127.6) n/a (105.6) (127.6) n/a
462.6 438.2 577.8
465.5 541.0 695.8
Risk asset ratio %% % %% %
Core Tier 1 10.7 11.0 5.9
10.7 11.0 6.6
Tier 1 12.9 14.4 9.9
12.9 14.1 10.0
Total 14.0 16.3 14.2
14.0 16.1 14.1
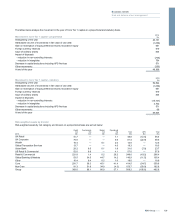
Key points
xCredit and counterparty RWAs fell by £15.8 billion principally due to
Non-Core disposals partially offset by regulatory and modelling
changes.
xMarket risk increased by £15.0 billion during the year principally due
to an event risk.
xThe reduction in APS RWA relief relates to the run-off of covered
assets.
xThe benefit of the APS to the Core Tier 1 ratio is 1.2% at 31
December 2010 (2009 - 1.6%).
xIn May 2010, the Group concluded a series of exchange and tender
offers with the holders of a number of Tier 1 and upper Tier 2
securities. As a result of the exchange and tender offers, the Group
realised an aggregate post-tax gain of £1.2 billion, which increased
the Group’s Core Tier 1 capital ratio by approximately 0.3% and
resulted in a reduction in the Group’s Total Tier 1 capital ratio of
approximately 0.5%.
xDuring the year the Group increased Core Tier 1 capital by £0.8
billion through the issue of ordinary shares on the conversion of
sterling and US dollar non-cumulative convertible preference shares.
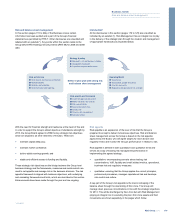
As part of the annual planning and budgeting cycle, each division is
allocated capital based upon RWAs and associated regulatory
deductions. The budgeting process considers risk appetite, available
capital resources, stress testing results and business strategy. The
budget is agreed by the Board and allocated to divisions to manage their
allocated RWAs.
Group Treasury and GALCO monitor available capital and its utilisation
across divisions. GALCO makes the necessary decisions around
reallocation of budget and changes in RWA allocations.
Individual Capital Adequacy Assessment Process (ICAAP)
In addition to the calculation of minimum capital requirements for credit,
market and operational risk, banks are required to undertake an ICAAP
for other risks. The Group’s ICAAP, in particular, focuses on pension fund
risk, interest rate risk in the banking book together with stress tests to
assess the adequacy of capital over one year and the economic cycle.
Pillar 3
The Group publishes its Pillar 3 (Market disclosures) on its website,
providing a range of additional information relating to Basel II and risk
and capital management across the Group. The disclosures focus on
capital resources and adequacy, discuss a range of credit risk
approaches and their associated RWAs under various Basel II
approaches such as credit risk mitigation, counterparty credit risk and
provisions. Detailed disclosures are also made on equity, securitisation,
operational and market risk, and interest rate risk in the banking book.
*unaudited
RBS Group 2010126
Business review continued