RBS 2010 Annual Report Download - page 18
Download and view the complete annual report
Please find page 18 of the 2010 RBS annual report below. You can navigate through the pages in the report by either clicking on the pages listed below, or by using the keyword search tool below to find specific information within the annual report.-
 1
1 -
2
-
3
-
4
-
5
-
6
-
7
-
 8
8 -
 9
9 -
 10
10 -
 11
11 -
 12
12 -
 13
13 -
 14
14 -
 15
15 -
 16
16 -
 17
17 -
 18
18 -
 19
19 -
 20
20 -
 21
21 -
 22
22 -
 23
23 -
 24
24 -
 25
25 -
 26
26 -
 27
27 -
 28
28 -
29
-
30
-
31
-
32
-
33
-
34
-
35
-
36
-
37
-
38
-
39
-
40
-
41
-
42
-
43
-
44
-
45
-
46
-
47
-
48
-
49
-
50
-
51
-
52
-
53
-
54
-
55
-
56
-
57
-
58
-
59
-
60
-
61
-
62
-
63
-
64
-
65
-
66
-
67
-
68
-
69
-
70
-
71
-
72
-
73
-
74
-
75
-
76
-
77
-
78
-
79
-
80
-
81
-
82
-
83
-
84
-
85
-
86
-
87
-
88
-
89
-
90
-
91
-
92
-
93
-
94
-
95
-
96
-
97
-
98
-
99
-
100
-
101
-
102
-
103
-
104
-
105
-
106
-
107
-
108
-
109
-
110
-
111
-
112
-
113
-
114
-
115
-
116
-
117
-
118
-
119
-
120
-
121
-
122
-
123
-
124
-
125
-
126
-
127
-
128
-
129
-
130
-
131
-
132
-
133
-
134
-
135
-
136
-
137
-
138
-
139
-
140
-
141
-
142
-
143
-
144
-
145
-
146
-
147
-
148
-
149
-
150
-
151
-
152
-
153
-
154
-
155
-
156
-
157
-
158
-
159
-
160
-
161
-
162
-
163
-
164
-
165
-
166
-
167
-
168
-
169
-
170
-
171
-
172
-
173
-
174
-
175
-
176
-
177
-
178
-
179
-
180
-
181
-
182
-
183
-
184
-
185
-
186
-
187
-
188
-
189
-
190
-
191
-
192
-
193
-
194
-
195
-
196
-
197
-
198
-
199
-
200
-
201
-
202
-
203
-
204
-
205
-
206
-
207
-
208
-
209
-
210
-
211
-
212
-
213
-
214
-
215
-
216
-
217
-
218
-
219
-
220
-
221
-
222
-
223
-
224
-
225
-
226
-
227
-
228
-
229
-
230
-
231
-
232
-
233
-
234
-
235
-
236
-
237
-
238
-
239
-
240
-
241
-
242
-
243
-
244
-
245
-
246
-
247
-
248
-
249
-
250
-
251
-
252
-
253
-
254
-
255
-
256
-
257
-
258
-
259
-
260
-
261
-
262
-
263
-
264
-
265
-
266
-
267
-
268
-
269
-
270
-
271
-
272
-
273
-
274
-
275
-
276
-
277
-
278
-
279
-
280
-
281
-
282
-
283
-
284
-
285
-
286
-
287
-
288
-
289
-
290
-
291
-
292
-
293
-
294
-
295
-
296
-
297
-
298
-
299
-
300
-
301
-
302
-
303
-
304
-
305
-
306
-
307
-
308
-
309
-
310
-
311
-
312
-
313
-
314
-
315
-
316
-
317
-
318
-
319
-
320
-
321
-
322
-
323
-
324
-
325
-
326
-
327
-
328
-
329
-
330
-
331
-
332
-
333
-
334
-
335
-
336
-
337
-
338
-
339
-
340
-
341
-
342
-
343
-
344
-
345
-
346
-
347
-
348
-
349
-
350
-
351
-
352
-
353
-
354
-
355
-
356
-
357
-
358
-
359
-
360
-
361
-
362
-
363
-
364
-
365
-
366
-
367
-
368
-
369
-
370
-
371
-
372
-
373
-
374
-
375
-
376
-
377
-
378
-
379
-
380
-
381
-
382
-
383
-
384
-
385
-
386
-
387
-
388
-
389
-
390
-
391
-
392
-
393
-
394
-
395
-
396
-
397
-
398
-
399
-
400
-
401
-
402
-
403
-
404
-
405
-
406
-
407
-
408
-
409
-
410
-
411
-
412
-
413
-
414
-
415
-
416
-
417
-
418
-
419
-
420
-
421
-
422
-
423
-
424
-
425
-
426
-
427
-
428
-
429
-
430
-
431
-
432
-
433
-
434
-
435
-
436
-
437
-
438
-
439
-
440
-
441
-
442
-
443
-
444
-
445
 |
 |

RBS Group 201016
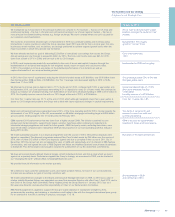
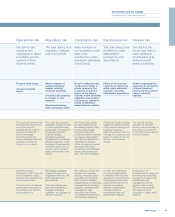
The economic environment
MKeep up with our latest economic research
and analysis at www.rbs.com/economics Current position
• UK and US economies in recovery
• Outlook for gradual improvement
• Indebtedness still a headwind
• Emerging economics still
outperforming
Possible risks
• Interest rates stay near zero bound,
or rise too rapidly
• Economic growth falters
• Sovereign credit risks not controlled
• Wholesale funding conditions deteriorate
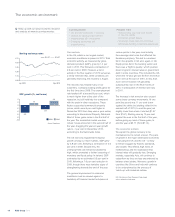
GDP growth (%, real terms)
-4.9
-2.6
1.3
2.8
-10
-8
-6
-4
-2
0
2
4
UK
2009
Source: Datastream
2010
UK
US
US
Sterling exchange rates
1.00
1.15
1.30
1.45
1.60
1.75
Jan 2010 Dec 2010
$ to £1 €to £1
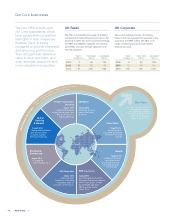
Our markets
In the UK, which is our largest market,
economic conditions improved in 2010. Total
economic activity, as measured by gross
domestic product (GDP), grew by 1.3 per
cent in 2010. This followed a contraction of
4.9 per cent in 2009. However, a fall in
activity in the final quarter of 2010 served as
a timely reminder that, while conditions are
generally improving, the recovery is fragile.
The recovery has helped many of our
customers. Company trading profits grew for
the first time since 2008. The unemployment
rate levelled off at around 8 per cent, which
is much higher than at the start of the
recession, but still relatively low compared
with the peak in other recessions. These
factors supported commercial property
prices, which were 6 per cent higher in
December 2010 than they were a year earlier,
according to International Property Databank.
Most of those gains came in the first half of
the year. The residential market was less
robust: house prices fell in the second half of
the year, dragging the year-on-year growth
rate to -1 per cent in December 2010,
according to the Nationwide index.
The US economy registered the fastest
growth among our main markets. GDP grew
by 2.8 per cent, following a contraction of 2.6
per cent in 2009. Despite this, the
unemployment rate remained stubbornly
high, which prompted a further loosening of
monetary and fiscal policy. In Ireland, GDP
contracted by an estimated 0.5 per cent in
2010, following a 7.6 per cent reduction in
2009, though there were tentative signs of
strengthening towards the end of the year.
The general improvement in economic
conditions must be viewed against a
backdrop of financial market turbulence at
various points in the year, most notably
the sovereign debt crisis that affected the
Eurozone periphery. This led to a marked
fall in risk appetite in Q2 and, again, in Q4.
Equity prices fell in the banking sector and
there was a ‘flight to quality’, which pushed
down long-term interest rates on government
debt in some countries. This included the UK,
where the 10-year gilt rate fell from more than
4 per cent at the start of 2010, to less than
3 per cent in October. UK gilt yields
subsequently rose in the final months of
2010, in anticipation of interest rate rises
in 2011.
The increase in risk aversion also caused
some sharp currency movements. At one
point the pound was 11 per cent down
against the dollar, but sterling rallied in the
second half of 2010, to end the year just
slightly lower than where it started ($1.57
from $1.61). Sterling rose by 10 per cent
against the euro in the first half of the year,
before giving up most of these gains, to
end the year at €1.17 (from €1.13).
The economic outlook
We expect the global recovery to be
maintained, but to remain uneven. The pace
of growth in the major developed economies
– including the UK and the US – is likely
to remain sluggish by historic standards,
and volatile. This reflects high levels of
indebtedness and the expectation that
interest rates will gradually rise. Emerging
markets, especially Asia, will continue to
outperform as they are less encumbered by
balance sheet strains. Moreover, growth in
countries like China and India will continue
to be underpinned by the process of
‘catch-up’ with industrial nations.
N.B. All data are from Thomson Datastream
unless otherwise indicated.