RBS 2010 Annual Report Download - page 76
Download and view the complete annual report
Please find page 76 of the 2010 RBS annual report below. You can navigate through the pages in the report by either clicking on the pages listed below, or by using the keyword search tool below to find specific information within the annual report.-
 1
1 -
2
-
3
-
4
-
5
-
6
-
7
-
8
-
9
-
10
-
11
-
12
-
13
-
14
-
15
-
16
-
17
-
18
-
19
-
20
-
21
-
22
-
23
-
24
-
25
-
26
-
27
-
28
-
29
-
30
-
31
-
32
-
33
-
34
-
35
-
36
-
37
-
38
-
39
-
40
-
41
-
42
-
43
-
44
-
45
-
46
-
47
-
48
-
49
-
50
-
51
-
52
-
53
-
54
-
55
-
56
-
57
-
58
-
59
-
60
-
61
-
62
-
63
-
64
-
65
-
 66
66 -
 67
67 -
 68
68 -
 69
69 -
 70
70 -
 71
71 -
 72
72 -
 73
73 -
 74
74 -
 75
75 -
 76
76 -
 77
77 -
 78
78 -
 79
79 -
 80
80 -
 81
81 -
 82
82 -
 83
83 -
 84
84 -
 85
85 -
 86
86 -
87
-
88
-
89
-
90
-
91
-
92
-
93
-
94
-
95
-
96
-
97
-
98
-
99
-
100
-
101
-
102
-
103
-
104
-
105
-
106
-
107
-
108
-
109
-
110
-
111
-
112
-
113
-
114
-
115
-
116
-
117
-
118
-
119
-
120
-
121
-
122
-
123
-
124
-
125
-
126
-
127
-
128
-
129
-
130
-
131
-
132
-
133
-
134
-
135
-
136
-
137
-
138
-
139
-
140
-
141
-
142
-
143
-
144
-
145
-
146
-
147
-
148
-
149
-
150
-
151
-
152
-
153
-
154
-
155
-
156
-
157
-
158
-
159
-
160
-
161
-
162
-
163
-
164
-
165
-
166
-
167
-
168
-
169
-
170
-
171
-
172
-
173
-
174
-
175
-
176
-
177
-
178
-
179
-
180
-
181
-
182
-
183
-
184
-
185
-
186
-
187
-
188
-
189
-
190
-
191
-
192
-
193
-
194
-
195
-
196
-
197
-
198
-
199
-
200
-
201
-
202
-
203
-
204
-
205
-
206
-
207
-
208
-
209
-
210
-
211
-
212
-
213
-
214
-
215
-
216
-
217
-
218
-
219
-
220
-
221
-
222
-
223
-
224
-
225
-
226
-
227
-
228
-
229
-
230
-
231
-
232
-
233
-
234
-
235
-
236
-
237
-
238
-
239
-
240
-
241
-
242
-
243
-
244
-
245
-
246
-
247
-
248
-
249
-
250
-
251
-
252
-
253
-
254
-
255
-
256
-
257
-
258
-
259
-
260
-
261
-
262
-
263
-
264
-
265
-
266
-
267
-
268
-
269
-
270
-
271
-
272
-
273
-
274
-
275
-
276
-
277
-
278
-
279
-
280
-
281
-
282
-
283
-
284
-
285
-
286
-
287
-
288
-
289
-
290
-
291
-
292
-
293
-
294
-
295
-
296
-
297
-
298
-
299
-
300
-
301
-
302
-
303
-
304
-
305
-
306
-
307
-
308
-
309
-
310
-
311
-
312
-
313
-
314
-
315
-
316
-
317
-
318
-
319
-
320
-
321
-
322
-
323
-
324
-
325
-
326
-
327
-
328
-
329
-
330
-
331
-
332
-
333
-
334
-
335
-
336
-
337
-
338
-
339
-
340
-
341
-
342
-
343
-
344
-
345
-
346
-
347
-
348
-
349
-
350
-
351
-
352
-
353
-
354
-
355
-
356
-
357
-
358
-
359
-
360
-
361
-
362
-
363
-
364
-
365
-
366
-
367
-
368
-
369
-
370
-
371
-
372
-
373
-
374
-
375
-
376
-
377
-
378
-
379
-
380
-
381
-
382
-
383
-
384
-
385
-
386
-
387
-
388
-
389
-
390
-
391
-
392
-
393
-
394
-
395
-
396
-
397
-
398
-
399
-
400
-
401
-
402
-
403
-
404
-
405
-
406
-
407
-
408
-
409
-
410
-
411
-
412
-
413
-
414
-
415
-
416
-
417
-
418
-
419
-
420
-
421
-
422
-
423
-
424
-
425
-
426
-
427
-
428
-
429
-
430
-
431
-
432
-
433
-
434
-
435
-
436
-
437
-
438
-
439
-
440
-
441
-
442
-
443
-
444
-
445
 |
 |

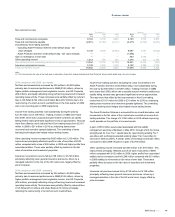
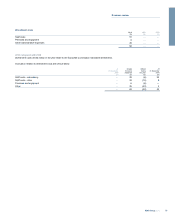
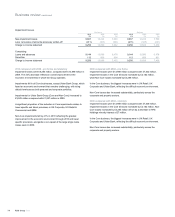
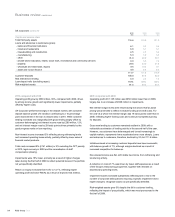
Impairment losses
Pro forma Statutory
2010 2009 2008 2010 2009 2008
£m £m £m £m £m £m
New impairment losses 9,667 14,224 7,693 9,667 14,224 7,700
Less: recoveries of amounts previously written-off (411) (325) (261) (411) (325) (261)
Charge to income statement 9,256 13,899 7,432 9,256 13,899 7,439
Comprising:
Loans and advances 9,144 13,090 6,478 9,144 13,090 6,478
Securities 112 809 954 112 809 961
Charge to income statement 9,256 13,899 7,432 9,256 13,899 7,439
2010 compared with 2009 - pro forma and statutory
Impairment losses were £9,256 million, compared with £13,899 million in
2009. The 33% decrease reflects an overall improvement in the
economic environments in which the Group operates.
Impairments fell in all Core businesses, except Ulster Bank Group, which
faced an economic environment that remains challenging, with rising
default levels across both personal and corporate portfolios.
Impairments for Ulster Bank Group (Core and Non-Core) increased to
£3,843 million compared with £1,927 million in 2009.
Asignificant proportion of the reduction in Core impairments relates to
lower specific and latent provisions in UK Corporate, US Retail &
Commercial and GBM.
Non-Core impairments fell by 41% in 2010 reflecting the gradual
improvement in the economic environment through 2010 and lower
specific provisions, alongside a non-repeat of the large single name
losses seen in 2009.
2009 compared with 2008 - pro forma
Impairment losses were £13,899 million compared with £7,432 million.
Impairment losses in the Core divisions increased by £2,182 million,
while Non-Core losses increased by £4,285 million.
In the Core business, the biggest increases were in UK Retail, UK
Corporate and Ulster Bank, reflecting the difficult economic environment.
Non-Core losses also increased substantially, particularly across the
corporate and property sectors.
2009 compared with 2008 - statutory
Impairment losses were £13,899 million compared with £7,439 million.
Impairment losses in the Core divisions increased by £2,182 million, Non-
Core losses increased by £4,285 million off-set by a decrease in RFS
Holdings minority interest of £7 million.
In the Core business, the biggest increases were in UK Retail, UK
Corporate and Ulster Bank, reflecting the difficult economic environment.
Non-Core losses also increased substantially, particularly across the
corporate and property sectors.
RBS Group 201074
Business review continued