RBS 2010 Annual Report Download - page 389
Download and view the complete annual report
Please find page 389 of the 2010 RBS annual report below. You can navigate through the pages in the report by either clicking on the pages listed below, or by using the keyword search tool below to find specific information within the annual report.-
 1
1 -
2
-
3
-
4
-
5
-
6
-
7
-
8
-
9
-
10
-
11
-
12
-
13
-
14
-
15
-
16
-
17
-
18
-
19
-
20
-
21
-
22
-
23
-
24
-
25
-
26
-
27
-
28
-
29
-
30
-
31
-
32
-
33
-
34
-
35
-
36
-
37
-
38
-
39
-
40
-
41
-
42
-
43
-
44
-
45
-
46
-
47
-
48
-
49
-
50
-
51
-
52
-
53
-
54
-
55
-
56
-
57
-
58
-
59
-
60
-
61
-
62
-
63
-
64
-
65
-
66
-
67
-
68
-
69
-
70
-
71
-
72
-
73
-
74
-
75
-
76
-
77
-
78
-
79
-
80
-
81
-
82
-
83
-
84
-
85
-
86
-
87
-
88
-
89
-
90
-
91
-
92
-
93
-
94
-
95
-
96
-
97
-
98
-
99
-
100
-
101
-
102
-
103
-
104
-
105
-
106
-
107
-
108
-
109
-
110
-
111
-
112
-
113
-
114
-
115
-
116
-
117
-
118
-
119
-
120
-
121
-
122
-
123
-
124
-
125
-
126
-
127
-
128
-
129
-
130
-
131
-
132
-
133
-
134
-
135
-
136
-
137
-
138
-
139
-
140
-
141
-
142
-
143
-
144
-
145
-
146
-
147
-
148
-
149
-
150
-
151
-
152
-
153
-
154
-
155
-
156
-
157
-
158
-
159
-
160
-
161
-
162
-
163
-
164
-
165
-
166
-
167
-
168
-
169
-
170
-
171
-
172
-
173
-
174
-
175
-
176
-
177
-
178
-
179
-
180
-
181
-
182
-
183
-
184
-
185
-
186
-
187
-
188
-
189
-
190
-
191
-
192
-
193
-
194
-
195
-
196
-
197
-
198
-
199
-
200
-
201
-
202
-
203
-
204
-
205
-
206
-
207
-
208
-
209
-
210
-
211
-
212
-
213
-
214
-
215
-
216
-
217
-
218
-
219
-
220
-
221
-
222
-
223
-
224
-
225
-
226
-
227
-
228
-
229
-
230
-
231
-
232
-
233
-
234
-
235
-
236
-
237
-
238
-
239
-
240
-
241
-
242
-
243
-
244
-
245
-
246
-
247
-
248
-
249
-
250
-
251
-
252
-
253
-
254
-
255
-
256
-
257
-
258
-
259
-
260
-
261
-
262
-
263
-
264
-
265
-
266
-
267
-
268
-
269
-
270
-
271
-
272
-
273
-
274
-
275
-
276
-
277
-
278
-
279
-
280
-
281
-
282
-
283
-
284
-
285
-
286
-
287
-
288
-
289
-
290
-
291
-
292
-
293
-
294
-
295
-
296
-
297
-
298
-
299
-
300
-
301
-
302
-
303
-
304
-
305
-
306
-
307
-
308
-
309
-
310
-
311
-
312
-
313
-
314
-
315
-
316
-
317
-
318
-
319
-
320
-
321
-
322
-
323
-
324
-
325
-
326
-
327
-
328
-
329
-
330
-
331
-
332
-
333
-
334
-
335
-
336
-
337
-
338
-
339
-
340
-
341
-
342
-
343
-
344
-
345
-
346
-
347
-
348
-
349
-
350
-
351
-
352
-
353
-
354
-
355
-
356
-
357
-
358
-
359
-
360
-
361
-
362
-
363
-
364
-
365
-
366
-
367
-
368
-
369
-
370
-
371
-
372
-
373
-
374
-
375
-
376
-
377
-
378
-
 379
379 -
 380
380 -
 381
381 -
 382
382 -
 383
383 -
 384
384 -
 385
385 -
 386
386 -
 387
387 -
 388
388 -
 389
389 -
 390
390 -
 391
391 -
 392
392 -
 393
393 -
 394
394 -
 395
395 -
 396
396 -
 397
397 -
 398
398 -
 399
399 -
400
-
401
-
402
-
403
-
404
-
405
-
406
-
407
-
408
-
409
-
410
-
411
-
412
-
413
-
414
-
415
-
416
-
417
-
418
-
419
-
420
-
421
-
422
-
423
-
424
-
425
-
426
-
427
-
428
-
429
-
430
-
431
-
432
-
433
-
434
-
435
-
436
-
437
-
438
-
439
-
440
-
441
-
442
-
443
-
444
-
445
 |
 |

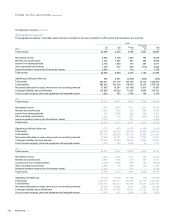
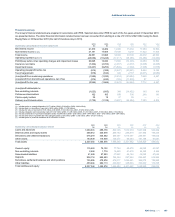
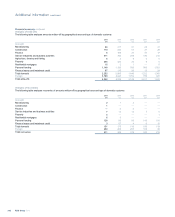
Financial summary
The Group's financial statements are prepared in accordance with IFRS. Selected data under IFRS for each of the five years ended 31 December 2010
are presented below. The dollar financial information included below has been converted from sterling at a rate of £1.00 to US$1.5392, being the Noon
Buying Rate on 30 December 2010 (the last US business day in 2010).
Summary consolidated income statement 2010
$m
2010
£m
2009
£m
2008
£m
2007
£m
2006
£m
Net interest income 21,870 14,209 13,388 15,482 11,550 10,596
Non-interest income (1,2,3) 27,181 17,659 19,638 5,248 17,922 17,406
Total income 49,051 31,868 33,026 20,730 29,472 28,002
Operating expenses (4,5,6,7)(28,056) (18,228) (17,417) (35,065) (13,383) (12,480)
Profit/(loss) before other operating charges and impairment losses 20,995 13,640 15,609 (14,335) 16,089 15,522
Insurance net claims (7,362) (4,783) (4,357) (3,917) (4,528) (4,458)
Impairment losses (14,247) (9,256) (13,899) (7,439) (1,925) (1,878)
Operating (loss)/profit before tax (614) (399) (2,647) (25,691) 9,636 9,186
Tax (charge)/credit (976) (634) 429 2,167 (2,011) (2,689)
(Loss)/profit from continuing operations (1,590) (1,033) (2,218) (23,524) 7,625 6,497
(Loss)/profit from discontinued operations, net of tax (974) (633) (105) (11,018) 87 —
(Loss)/profit for the year (2,564) (1,666) (2,323) (34,542) 7,712 6,497
(Loss)/profit attributable to:
Non-controlling interests (1,023) (665) 349 (10,832) 163 104
Preference shareholders 162 105 878 536 246 191
Paid-in equity holders 29 19 57 60 — —
Ordinary and B shareholders (1,732) (1,125) (3,607) (24,306) 7,303 6,202
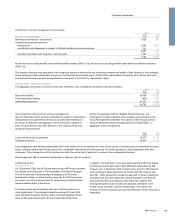
Notes:
(1) Includes gains on strategic disposals of £171 million (2009 - £132 million; 2008 - £442 million).
(2) Includes gain on redemption of own debt of £553 million (2009 - £3,790 million).
(3) Includes fair value of own debt of £174 million profit (2009 - £142 million loss; 2008 - £1,232 million profit).
(4) Includes integration and restructuring costs of £1,032 million (2009 - £1,286 million; 2008 - £1,357 million; 2007 - £108 million; 2006 - £134 million).
(5) Includes amortisation of purchased intangible assets of £369 million (2009 - £272 million; 2008 - £443 million; 2007 - £162 million; 2006 - £94 million).
(6) Includes write-down of goodwill and other intangible assets of £10 million (2009 - £363 million; 2008 - £16,911 million).
(7) Includes gains on pensions curtailment of £2,148 million in 2009.
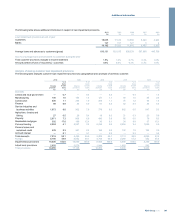
Summary consolidated balance sheet 2010
$m
2010
£m
2009
£m
2008
£m
2007
£m
2006
£m
Loans and advances 1,009,374 655,778 820,146 1,012,919 1,047,998 549,499
Debt securities and equity shares 368,912 239,678 286,782 293,879 347,682 146,246
Derivatives and settlement balances 675,219 438,682 453,487 1,010,391 293,991 109,506
Other assets 183,839 119,438 136,071 84,463 151,158 51,581
Total assets 2,237,344 1,453,576 1,696,486 2,401,652 1,840,829 856,832
Owners' equity 115,643 75,132 77,736 58,879 53,038 40,227
Non-controlling interests 2,646 1,719
16,895 21,619 38,388 5,263
Subordinated liabilities 41,640 27,053 37,652 49,154 38,043 27,654
Deposits 938,116 609,483 756,346 897,556 994,657 516,365
Derivatives, settlement balances and short positions 735,855 478,076 475,017 1,025,641 363,073 152,988
Other liabilities 403,444 262,113 332,840 348,803 353,630 114,335
Total liabilities and equity 2,237,344 1,453,576 1,696,486 2,401,652 1,840,829 856,832
387RBS Group 2010
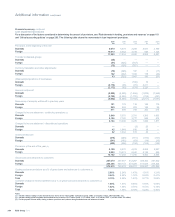
Additional information