RBS 2010 Annual Report Download - page 113
Download and view the complete annual report
Please find page 113 of the 2010 RBS annual report below. You can navigate through the pages in the report by either clicking on the pages listed below, or by using the keyword search tool below to find specific information within the annual report.-
 1
1 -
2
-
3
-
4
-
5
-
6
-
7
-
8
-
9
-
10
-
11
-
12
-
13
-
14
-
15
-
16
-
17
-
18
-
19
-
20
-
21
-
22
-
23
-
24
-
25
-
26
-
27
-
28
-
29
-
30
-
31
-
32
-
33
-
34
-
35
-
36
-
37
-
38
-
39
-
40
-
41
-
42
-
43
-
44
-
45
-
46
-
47
-
48
-
49
-
50
-
51
-
52
-
53
-
54
-
55
-
56
-
57
-
58
-
59
-
60
-
61
-
62
-
63
-
64
-
65
-
66
-
67
-
68
-
69
-
70
-
71
-
72
-
73
-
74
-
75
-
76
-
77
-
78
-
79
-
80
-
81
-
82
-
83
-
84
-
85
-
86
-
87
-
88
-
89
-
90
-
91
-
92
-
93
-
94
-
95
-
96
-
97
-
98
-
99
-
100
-
101
-
102
-
 103
103 -
 104
104 -
 105
105 -
 106
106 -
 107
107 -
 108
108 -
 109
109 -
 110
110 -
 111
111 -
 112
112 -
 113
113 -
 114
114 -
 115
115 -
 116
116 -
 117
117 -
 118
118 -
 119
119 -
 120
120 -
 121
121 -
 122
122 -
 123
123 -
124
-
125
-
126
-
127
-
128
-
129
-
130
-
131
-
132
-
133
-
134
-
135
-
136
-
137
-
138
-
139
-
140
-
141
-
142
-
143
-
144
-
145
-
146
-
147
-
148
-
149
-
150
-
151
-
152
-
153
-
154
-
155
-
156
-
157
-
158
-
159
-
160
-
161
-
162
-
163
-
164
-
165
-
166
-
167
-
168
-
169
-
170
-
171
-
172
-
173
-
174
-
175
-
176
-
177
-
178
-
179
-
180
-
181
-
182
-
183
-
184
-
185
-
186
-
187
-
188
-
189
-
190
-
191
-
192
-
193
-
194
-
195
-
196
-
197
-
198
-
199
-
200
-
201
-
202
-
203
-
204
-
205
-
206
-
207
-
208
-
209
-
210
-
211
-
212
-
213
-
214
-
215
-
216
-
217
-
218
-
219
-
220
-
221
-
222
-
223
-
224
-
225
-
226
-
227
-
228
-
229
-
230
-
231
-
232
-
233
-
234
-
235
-
236
-
237
-
238
-
239
-
240
-
241
-
242
-
243
-
244
-
245
-
246
-
247
-
248
-
249
-
250
-
251
-
252
-
253
-
254
-
255
-
256
-
257
-
258
-
259
-
260
-
261
-
262
-
263
-
264
-
265
-
266
-
267
-
268
-
269
-
270
-
271
-
272
-
273
-
274
-
275
-
276
-
277
-
278
-
279
-
280
-
281
-
282
-
283
-
284
-
285
-
286
-
287
-
288
-
289
-
290
-
291
-
292
-
293
-
294
-
295
-
296
-
297
-
298
-
299
-
300
-
301
-
302
-
303
-
304
-
305
-
306
-
307
-
308
-
309
-
310
-
311
-
312
-
313
-
314
-
315
-
316
-
317
-
318
-
319
-
320
-
321
-
322
-
323
-
324
-
325
-
326
-
327
-
328
-
329
-
330
-
331
-
332
-
333
-
334
-
335
-
336
-
337
-
338
-
339
-
340
-
341
-
342
-
343
-
344
-
345
-
346
-
347
-
348
-
349
-
350
-
351
-
352
-
353
-
354
-
355
-
356
-
357
-
358
-
359
-
360
-
361
-
362
-
363
-
364
-
365
-
366
-
367
-
368
-
369
-
370
-
371
-
372
-
373
-
374
-
375
-
376
-
377
-
378
-
379
-
380
-
381
-
382
-
383
-
384
-
385
-
386
-
387
-
388
-
389
-
390
-
391
-
392
-
393
-
394
-
395
-
396
-
397
-
398
-
399
-
400
-
401
-
402
-
403
-
404
-
405
-
406
-
407
-
408
-
409
-
410
-
411
-
412
-
413
-
414
-
415
-
416
-
417
-
418
-
419
-
420
-
421
-
422
-
423
-
424
-
425
-
426
-
427
-
428
-
429
-
430
-
431
-
432
-
433
-
434
-
435
-
436
-
437
-
438
-
439
-
440
-
441
-
442
-
443
-
444
-
445
 |
 |

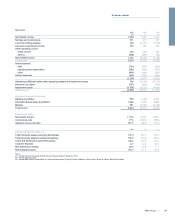
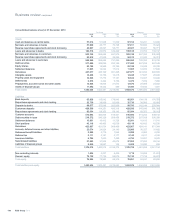
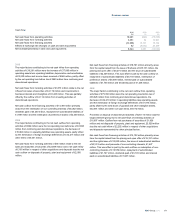
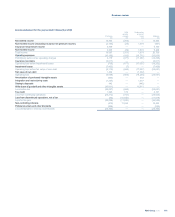
Cash flow
2010 2009 2008
£m £m £m
Net cash flows from operating activities 19,291 (992) (75,338)
Net cash flows from investing activities 3,351 54 16,997
Net cash flows from financing activities (14,380) 18,791 15,102
Effects of exchange rate changes on cash and cash equivalents 82 (8,592) 29,209
Net increase/(decrease) in cash and cash equivalents 8,344 9,261 (14,030)
2010
The major factors contributing to the net cash inflow from operating
activities of £19,291 million were the increase of £17,095 million in
operating assets less operating liabilities, depreciation and amortisation
of £2,220 million and income taxes received of £565 million, partly offset
by the net operating loss before tax of £940 million from continuing and
discontinued operations.
Net cash flows from investing activities of £3,351 million relate to the net
inflows from sales of securities of £4,119 million and investments in
business interests and intangibles of £3,446 million. This was partially
offset by the outflow of £4,112 million from investing activities of
discontinued operations.
Net cash outflow from financing activities of £14,380 million primarily
arose from the redemption of non-controlling interests of £5,282 million,
dividends paid of £4,240 million, repayment of subordinated liabilities of
£1,588 million and the redemption of preference shares of £2,359 million.
2009
The major factors contributing to the net cash outflow from operating
activities of £992 million were the net operating loss before tax of £2,696
million from continuing and discontinued operations, the decrease of
£15,964 million in operating liabilities less operating assets, partly offset
by the elimination of foreign exchange differences of £12,217 million and
other items of £5,451 million.
Net cash flows from investing activities of £54 million relate to the net
sales and maturities of securities of £2,899 million and a net cash inflow
of £105 million in respect of other acquisitions and disposals less the net
cash outflow on disposals of property, plant and equipment of £2,950
million.
Net cash flows from financing activities of £18,791 million primarily arose
from the capital raised from the issue of B shares of £25,101 million, the
placing and open offer of £5,274 million and the issue of subordinated
liabilities of £2,309 million. This was offset in part by the cash outflow on
repayment of subordinated liabilities of £5,145 million, redemption of
preference shares of £5,000 million, interest paid on subordinated
liabilities of £1,746 million and dividends paid of £1,248 million.
2008
The major factors contributing to the net cash outflow from operating
activities of £75,338 million were the net operating loss before tax of
£36,628 million from continuing and discontinued operations, the
decrease of £42,219 million in operating liabilities less operating assets,
and the elimination of foreign exchange differences of £41,874 million,
partly offset by the write down of goodwill and other intangible assets,
£32,581 million and other non-cash items, £8,772 million.
Proceeds on disposal of discontinued activities of £20,113 million was the
largest element giving rise to net cash flows of investing activities of
£16,997 million. Outflow from net purchases of securities of £1,839
million and net disposals of property, plant and equipment, £3,529 million
less the net cash inflow of £2,252 million in respect of other acquisitions
and disposals represented the other principal factors.
Net cash flows from financing activities of £15,102 million primarily arose
from the capital raised from the placing and open offer of £19,741 million
and the rights issue of £12,000 million, the issue of subordinated liabilities
of £2,413 million and proceeds of non-controlling interests, £1,427
million. This was offset in part by the cash outflow on redemption of non-
controlling interests of £13,579 million, repayment of subordinated
liabilities of £1,727 million, dividends paid of £3,193 million and interest
paid on subordinated liabilities of £1,967 million.
111RBS Group 2010
Business review