RBS 2010 Annual Report Download - page 170
Download and view the complete annual report
Please find page 170 of the 2010 RBS annual report below. You can navigate through the pages in the report by either clicking on the pages listed below, or by using the keyword search tool below to find specific information within the annual report.-
 1
1 -
2
-
3
-
4
-
5
-
6
-
7
-
8
-
9
-
10
-
11
-
12
-
13
-
14
-
15
-
16
-
17
-
18
-
19
-
20
-
21
-
22
-
23
-
24
-
25
-
26
-
27
-
28
-
29
-
30
-
31
-
32
-
33
-
34
-
35
-
36
-
37
-
38
-
39
-
40
-
41
-
42
-
43
-
44
-
45
-
46
-
47
-
48
-
49
-
50
-
51
-
52
-
53
-
54
-
55
-
56
-
57
-
58
-
59
-
60
-
61
-
62
-
63
-
64
-
65
-
66
-
67
-
68
-
69
-
70
-
71
-
72
-
73
-
74
-
75
-
76
-
77
-
78
-
79
-
80
-
81
-
82
-
83
-
84
-
85
-
86
-
87
-
88
-
89
-
90
-
91
-
92
-
93
-
94
-
95
-
96
-
97
-
98
-
99
-
100
-
101
-
102
-
103
-
104
-
105
-
106
-
107
-
108
-
109
-
110
-
111
-
112
-
113
-
114
-
115
-
116
-
117
-
118
-
119
-
120
-
121
-
122
-
123
-
124
-
125
-
126
-
127
-
128
-
129
-
130
-
131
-
132
-
133
-
134
-
135
-
136
-
137
-
138
-
139
-
140
-
141
-
142
-
143
-
144
-
145
-
146
-
147
-
148
-
149
-
150
-
151
-
152
-
153
-
154
-
155
-
156
-
157
-
158
-
159
-
 160
160 -
 161
161 -
 162
162 -
 163
163 -
 164
164 -
 165
165 -
 166
166 -
 167
167 -
 168
168 -
 169
169 -
 170
170 -
 171
171 -
 172
172 -
 173
173 -
 174
174 -
 175
175 -
 176
176 -
 177
177 -
 178
178 -
 179
179 -
 180
180 -
181
-
182
-
183
-
184
-
185
-
186
-
187
-
188
-
189
-
190
-
191
-
192
-
193
-
194
-
195
-
196
-
197
-
198
-
199
-
200
-
201
-
202
-
203
-
204
-
205
-
206
-
207
-
208
-
209
-
210
-
211
-
212
-
213
-
214
-
215
-
216
-
217
-
218
-
219
-
220
-
221
-
222
-
223
-
224
-
225
-
226
-
227
-
228
-
229
-
230
-
231
-
232
-
233
-
234
-
235
-
236
-
237
-
238
-
239
-
240
-
241
-
242
-
243
-
244
-
245
-
246
-
247
-
248
-
249
-
250
-
251
-
252
-
253
-
254
-
255
-
256
-
257
-
258
-
259
-
260
-
261
-
262
-
263
-
264
-
265
-
266
-
267
-
268
-
269
-
270
-
271
-
272
-
273
-
274
-
275
-
276
-
277
-
278
-
279
-
280
-
281
-
282
-
283
-
284
-
285
-
286
-
287
-
288
-
289
-
290
-
291
-
292
-
293
-
294
-
295
-
296
-
297
-
298
-
299
-
300
-
301
-
302
-
303
-
304
-
305
-
306
-
307
-
308
-
309
-
310
-
311
-
312
-
313
-
314
-
315
-
316
-
317
-
318
-
319
-
320
-
321
-
322
-
323
-
324
-
325
-
326
-
327
-
328
-
329
-
330
-
331
-
332
-
333
-
334
-
335
-
336
-
337
-
338
-
339
-
340
-
341
-
342
-
343
-
344
-
345
-
346
-
347
-
348
-
349
-
350
-
351
-
352
-
353
-
354
-
355
-
356
-
357
-
358
-
359
-
360
-
361
-
362
-
363
-
364
-
365
-
366
-
367
-
368
-
369
-
370
-
371
-
372
-
373
-
374
-
375
-
376
-
377
-
378
-
379
-
380
-
381
-
382
-
383
-
384
-
385
-
386
-
387
-
388
-
389
-
390
-
391
-
392
-
393
-
394
-
395
-
396
-
397
-
398
-
399
-
400
-
401
-
402
-
403
-
404
-
405
-
406
-
407
-
408
-
409
-
410
-
411
-
412
-
413
-
414
-
415
-
416
-
417
-
418
-
419
-
420
-
421
-
422
-
423
-
424
-
425
-
426
-
427
-
428
-
429
-
430
-
431
-
432
-
433
-
434
-
435
-
436
-
437
-
438
-
439
-
440
-
441
-
442
-
443
-
444
-
445
 |
 |

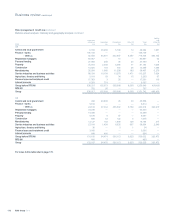
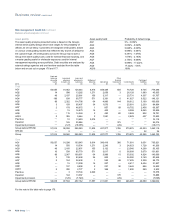
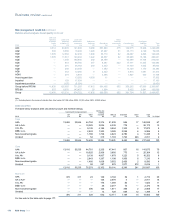
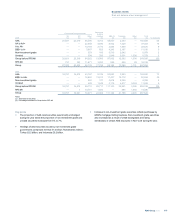
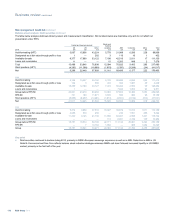
Risk management: Credit risk continued
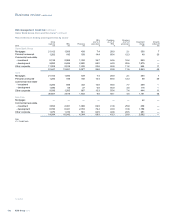
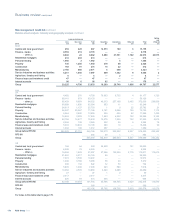
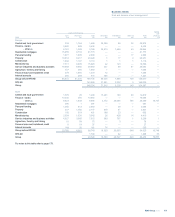
Balance sheet analysis: Industry and geography analysis continued
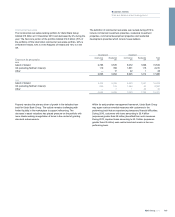
Loans and advances to banks and customers by geography
The table belowanalyses loans and advances gross of provisions by geography (location of office).
2010 2009 2008
£m £m £m
Loans and advances to banks (1)
-UK 70,400 59,348 106,913
- US 9,810 8,537 5,830
- Europe 10,655 5,535 7,670
- RoW 9,778 10,611 9,213
Group before RFS MI 100,643 84,031 129,626
RFS MI 27,879 8,698
100,645 91,910 138,324
Loans and advances to customers
- UK 374,822 386,798 431,302
- US 90,752 93,209 125,786
- Europe 83,586 102,571 135,524
- RoW 24,155 28,132 47,977
Group before RFS MI 573,315 610,710 740,589
RFS MI —134,809 145,022
573,315 745,519 885,611
Group before RFS MI 673,958 694,741 870,215
RFS MI 2142,688 153,720
Group 673,960 837,429 1,023,935
Note:
(1) Loans and advances to banks includes £36 million of accrued interest (2009 - £399 million; 2008 - £2,339 million).
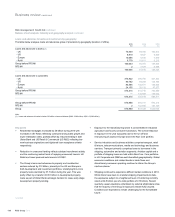
Key points
xResidential mortgages increased by £6 billion during 2010 with
increases in UK Retail, reflecting continued strong sales growth and
lower redemption rates, partially offset by reduced lending in both
Ulster Bank and US Retail & Commercial (US R&C) reflecting low
new business originations and tightened loan acceptance criteria
respectively.
xReduction in unsecured lending reflects subdued recruitment activity
and the continuing market trend of repaying unsecured loans in UK
Retail and lower personal auto loans in US R&C.
xThe Group’s loans and advances to property and construction
sectors reduced by £12 billion, primarily in the UK and Europe in
both development and investment portfolios. Underlying Non-Core
property loans declined by £7.7 billion during the year. This was
partly offset by a transfer of £5.0 billion in development property
loans as part of Ulster Banks strategic decision to cease early stage
development property lending.
xExposure to the manufacturing sector is concentrated in industrial
agriculture and food & consumer subsectors. The overall reduction
in exposure in the year was partly due to the run off and
restructuring of assets in Europe and in the Non Core portfolio.
xService industries and business activities comprise transport, retail
&leisure, telecommunications, media and technology and business
services. Transport primarily comprises loans to borrowers in the
shipping, automotive and aviation segments. Aviation capital and a
portfolio of shipping loans are held within Non-Core. Core portfolios
in UK Corporate and GBM are well diversified geographically. Global
economic conditions and related trends in trade flows and
discretionary consumer spending continue to inform the Group’s
cautious stance.*
xShipping continued to experience difficult market conditions in 2010.
Whilst there have been no material shipping impairments to date,
the exposures subject to a heightened level of monitoring currently
stand at £2.8 billion (out of a total portfolio of £13 billion). Recent
quarterly vessel valuations undertaken by external shipbrokers show
that the majority of the Group’s exposures remain fully secured.
Conditions are expected to remain challenging for the foreseeable
future.*
*unaudited
RBS Group 2010168
Business review continued