RBS 2010 Annual Report Download - page 80
Download and view the complete annual report
Please find page 80 of the 2010 RBS annual report below. You can navigate through the pages in the report by either clicking on the pages listed below, or by using the keyword search tool below to find specific information within the annual report.-
 1
1 -
2
-
3
-
4
-
5
-
6
-
7
-
8
-
9
-
10
-
11
-
12
-
13
-
14
-
15
-
16
-
17
-
18
-
19
-
20
-
21
-
22
-
23
-
24
-
25
-
26
-
27
-
28
-
29
-
30
-
31
-
32
-
33
-
34
-
35
-
36
-
37
-
38
-
39
-
40
-
41
-
42
-
43
-
44
-
45
-
46
-
47
-
48
-
49
-
50
-
51
-
52
-
53
-
54
-
55
-
56
-
57
-
58
-
59
-
60
-
61
-
62
-
63
-
64
-
65
-
66
-
67
-
68
-
69
-
 70
70 -
 71
71 -
 72
72 -
 73
73 -
 74
74 -
 75
75 -
 76
76 -
 77
77 -
 78
78 -
 79
79 -
 80
80 -
 81
81 -
 82
82 -
 83
83 -
 84
84 -
 85
85 -
 86
86 -
 87
87 -
 88
88 -
 89
89 -
 90
90 -
91
-
92
-
93
-
94
-
95
-
96
-
97
-
98
-
99
-
100
-
101
-
102
-
103
-
104
-
105
-
106
-
107
-
108
-
109
-
110
-
111
-
112
-
113
-
114
-
115
-
116
-
117
-
118
-
119
-
120
-
121
-
122
-
123
-
124
-
125
-
126
-
127
-
128
-
129
-
130
-
131
-
132
-
133
-
134
-
135
-
136
-
137
-
138
-
139
-
140
-
141
-
142
-
143
-
144
-
145
-
146
-
147
-
148
-
149
-
150
-
151
-
152
-
153
-
154
-
155
-
156
-
157
-
158
-
159
-
160
-
161
-
162
-
163
-
164
-
165
-
166
-
167
-
168
-
169
-
170
-
171
-
172
-
173
-
174
-
175
-
176
-
177
-
178
-
179
-
180
-
181
-
182
-
183
-
184
-
185
-
186
-
187
-
188
-
189
-
190
-
191
-
192
-
193
-
194
-
195
-
196
-
197
-
198
-
199
-
200
-
201
-
202
-
203
-
204
-
205
-
206
-
207
-
208
-
209
-
210
-
211
-
212
-
213
-
214
-
215
-
216
-
217
-
218
-
219
-
220
-
221
-
222
-
223
-
224
-
225
-
226
-
227
-
228
-
229
-
230
-
231
-
232
-
233
-
234
-
235
-
236
-
237
-
238
-
239
-
240
-
241
-
242
-
243
-
244
-
245
-
246
-
247
-
248
-
249
-
250
-
251
-
252
-
253
-
254
-
255
-
256
-
257
-
258
-
259
-
260
-
261
-
262
-
263
-
264
-
265
-
266
-
267
-
268
-
269
-
270
-
271
-
272
-
273
-
274
-
275
-
276
-
277
-
278
-
279
-
280
-
281
-
282
-
283
-
284
-
285
-
286
-
287
-
288
-
289
-
290
-
291
-
292
-
293
-
294
-
295
-
296
-
297
-
298
-
299
-
300
-
301
-
302
-
303
-
304
-
305
-
306
-
307
-
308
-
309
-
310
-
311
-
312
-
313
-
314
-
315
-
316
-
317
-
318
-
319
-
320
-
321
-
322
-
323
-
324
-
325
-
326
-
327
-
328
-
329
-
330
-
331
-
332
-
333
-
334
-
335
-
336
-
337
-
338
-
339
-
340
-
341
-
342
-
343
-
344
-
345
-
346
-
347
-
348
-
349
-
350
-
351
-
352
-
353
-
354
-
355
-
356
-
357
-
358
-
359
-
360
-
361
-
362
-
363
-
364
-
365
-
366
-
367
-
368
-
369
-
370
-
371
-
372
-
373
-
374
-
375
-
376
-
377
-
378
-
379
-
380
-
381
-
382
-
383
-
384
-
385
-
386
-
387
-
388
-
389
-
390
-
391
-
392
-
393
-
394
-
395
-
396
-
397
-
398
-
399
-
400
-
401
-
402
-
403
-
404
-
405
-
406
-
407
-
408
-
409
-
410
-
411
-
412
-
413
-
414
-
415
-
416
-
417
-
418
-
419
-
420
-
421
-
422
-
423
-
424
-
425
-
426
-
427
-
428
-
429
-
430
-
431
-
432
-
433
-
434
-
435
-
436
-
437
-
438
-
439
-
440
-
441
-
442
-
443
-
444
-
445
 |
 |

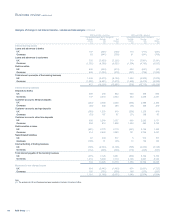
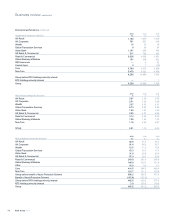
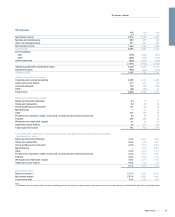
Divisional performance continued
Impairment losses by division 2010
£m
2009
£m
2008
£m
UK Retail 1,160 1,679 1,019
UK Corporate 761 927 319
Wealth 18 33 16
Global Transaction Services 939 54
Ulster Bank 1,161 649 106
US Retail & Commercial 517 702 437
Retail & Commercial 3,626 4,029 1,951
Global Banking & Markets 151 640 522
RBS Insurance —8 42
Central items 31 (19)
Core 3,780 4,678 2,496
Non-Core 5,476 9,221 4,936
9,256 13,899 7,432
Group before RFS Holdings minority interest
RFS Holdings minority interest —— 7
Group 9,256 13,899 7,439
Net interest margin by division 2010
%
2009
%
2008
%
UK Retail 3.91 3.59 3.58
UK Corporate 2.51 2.22 2.40
Wealth 3.37 4.38 4.51
Global Transaction Services 6.73 9.22 8.25
Ulster Bank 1.84 1.87 1.89
US Retail & Commercial 2.85 2.37 2.68
Retail & Commercial 3.14 2.89 3.00
Global Banking & Markets 1.05 1.38 1.34
Non-Core 1.16 0.69 0.87
Group 2.01 1.76 2.08
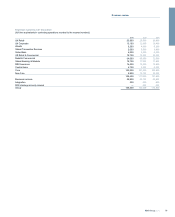
2010 2009 2008
Risk-weighted assets by division £bn £bn £bn
UK Retail 48.8 51.3 45.7
UK Corporate 81.4 90.2 85.7
Wealth 12.5 11.2 10.8
Global Transaction Services 18.3 19.1 17.4
Ulster Bank 31.6 29.9 24.5
US Retail & Commercial 57.0 59.7 63.9
Retail & Commercial 249.6 261.4 248.0
Global Banking & Markets 146.9 123.7 151.8
Other 18.0 9.4 7.1
Core 414.5 394.5 406.9
Non-Core 153.7 171.3 170.9
Group before benefit of Asset Protection Scheme 568.2 565.8 577.8
Benefit of Asset Protection Scheme (105.6) (127.6) —
Group before RFS Holdings minority interest 462.6 438.2 577.8
RFS Holdings minority interest 2.9 102.8 118.0
Group 465.5 541.0 695.8
RBS Group 201078
Business review continued