RBS 2010 Annual Report Download - page 215
Download and view the complete annual report
Please find page 215 of the 2010 RBS annual report below. You can navigate through the pages in the report by either clicking on the pages listed below, or by using the keyword search tool below to find specific information within the annual report.-
 1
1 -
2
-
3
-
4
-
5
-
6
-
7
-
8
-
9
-
10
-
11
-
12
-
13
-
14
-
15
-
16
-
17
-
18
-
19
-
20
-
21
-
22
-
23
-
24
-
25
-
26
-
27
-
28
-
29
-
30
-
31
-
32
-
33
-
34
-
35
-
36
-
37
-
38
-
39
-
40
-
41
-
42
-
43
-
44
-
45
-
46
-
47
-
48
-
49
-
50
-
51
-
52
-
53
-
54
-
55
-
56
-
57
-
58
-
59
-
60
-
61
-
62
-
63
-
64
-
65
-
66
-
67
-
68
-
69
-
70
-
71
-
72
-
73
-
74
-
75
-
76
-
77
-
78
-
79
-
80
-
81
-
82
-
83
-
84
-
85
-
86
-
87
-
88
-
89
-
90
-
91
-
92
-
93
-
94
-
95
-
96
-
97
-
98
-
99
-
100
-
101
-
102
-
103
-
104
-
105
-
106
-
107
-
108
-
109
-
110
-
111
-
112
-
113
-
114
-
115
-
116
-
117
-
118
-
119
-
120
-
121
-
122
-
123
-
124
-
125
-
126
-
127
-
128
-
129
-
130
-
131
-
132
-
133
-
134
-
135
-
136
-
137
-
138
-
139
-
140
-
141
-
142
-
143
-
144
-
145
-
146
-
147
-
148
-
149
-
150
-
151
-
152
-
153
-
154
-
155
-
156
-
157
-
158
-
159
-
160
-
161
-
162
-
163
-
164
-
165
-
166
-
167
-
168
-
169
-
170
-
171
-
172
-
173
-
174
-
175
-
176
-
177
-
178
-
179
-
180
-
181
-
182
-
183
-
184
-
185
-
186
-
187
-
188
-
189
-
190
-
191
-
192
-
193
-
194
-
195
-
196
-
197
-
198
-
199
-
200
-
201
-
202
-
203
-
204
-
 205
205 -
 206
206 -
 207
207 -
 208
208 -
 209
209 -
 210
210 -
 211
211 -
 212
212 -
 213
213 -
 214
214 -
 215
215 -
 216
216 -
 217
217 -
 218
218 -
 219
219 -
 220
220 -
 221
221 -
 222
222 -
 223
223 -
 224
224 -
 225
225 -
226
-
227
-
228
-
229
-
230
-
231
-
232
-
233
-
234
-
235
-
236
-
237
-
238
-
239
-
240
-
241
-
242
-
243
-
244
-
245
-
246
-
247
-
248
-
249
-
250
-
251
-
252
-
253
-
254
-
255
-
256
-
257
-
258
-
259
-
260
-
261
-
262
-
263
-
264
-
265
-
266
-
267
-
268
-
269
-
270
-
271
-
272
-
273
-
274
-
275
-
276
-
277
-
278
-
279
-
280
-
281
-
282
-
283
-
284
-
285
-
286
-
287
-
288
-
289
-
290
-
291
-
292
-
293
-
294
-
295
-
296
-
297
-
298
-
299
-
300
-
301
-
302
-
303
-
304
-
305
-
306
-
307
-
308
-
309
-
310
-
311
-
312
-
313
-
314
-
315
-
316
-
317
-
318
-
319
-
320
-
321
-
322
-
323
-
324
-
325
-
326
-
327
-
328
-
329
-
330
-
331
-
332
-
333
-
334
-
335
-
336
-
337
-
338
-
339
-
340
-
341
-
342
-
343
-
344
-
345
-
346
-
347
-
348
-
349
-
350
-
351
-
352
-
353
-
354
-
355
-
356
-
357
-
358
-
359
-
360
-
361
-
362
-
363
-
364
-
365
-
366
-
367
-
368
-
369
-
370
-
371
-
372
-
373
-
374
-
375
-
376
-
377
-
378
-
379
-
380
-
381
-
382
-
383
-
384
-
385
-
386
-
387
-
388
-
389
-
390
-
391
-
392
-
393
-
394
-
395
-
396
-
397
-
398
-
399
-
400
-
401
-
402
-
403
-
404
-
405
-
406
-
407
-
408
-
409
-
410
-
411
-
412
-
413
-
414
-
415
-
416
-
417
-
418
-
419
-
420
-
421
-
422
-
423
-
424
-
425
-
426
-
427
-
428
-
429
-
430
-
431
-
432
-
433
-
434
-
435
-
436
-
437
-
438
-
439
-
440
-
441
-
442
-
443
-
444
-
445
 |
 |

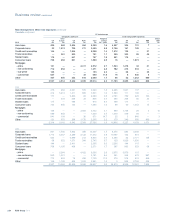
Key points
xExposure to monolines decreased over the period due to a
combination of restructuring certain exposures and higher prices of
underlying reference instruments, partially offset by the
strengthening of the US dollar against sterling.
xThe CVA decreased on a total basis, reflecting the reduction in
exposure, but was stable on a relative basis with the impact of
tighter credit spreads offset by an increase in the expected lives of
certain trades.
xThe reduction in the Group’s RWA requirements over the quarter
was driven by the reduction in exposure to monolines and the
impact of restructuring certain risk structures.
xDuring the year there was a significant increase in the RWA
requirements of RBS N.V. following its migration to the Basel II
regime. Regulatory intervention at certain monoline counterparties
triggered International Swaps and Derivative Association (ISDA)
credit events in the period. At the point of trigger the exposure to
these counterparties was excluded from the RWA calculations and
capital deductions of £171 million were taken instead. The impact of
this together with restructuring certain exposures and an
improvement in the rating of underlying reference bonds held by the
Group to investment grade status were the main drivers of the
reduction in RWA requirements during the second half of the year. *
The Group also has indirect exposures to monoline insurers through
wrapped securities and other assets with credit enhancement from
monoline insurers. These securities are traded with the benefit of this
credit enhancement. Any deterioration in the credit rating of the monoline
is reflected in the fair value of these assets.
Credit derivative product companies
Acredit derivative product company (CDPC) is a company that sells
protection on credit derivatives. CDPCs are similar to monoline insurers,
however, they are not regulated as insurers.
The Group has purchased credit protection from CDPCs through
tranched and single name credit derivatives. The Group's exposure to
CDPCs is predominantly due to tranched credit derivatives (“tranches”). A
tranche references a portfolio of loans and bonds and provides protection
against total portfolio default losses exceeding a certain percentage of
the portfolio notional (the attachment point) up to another percentage (the
detachment point).
The Group has predominantly traded senior tranches with CDPCs, the
average attachment and detachment points are 13% and 49%
respectively (2009 - 15% and 51% respectively; 2008 - 16% and 50%
respectively), and the majority of the loans and bonds in the reference
portfolios are investment grade.
The gross mark-to-market of the CDPC protection is determined using
industry standard models. The methodology employed to calculate the
CDPC CVA is different to that outlined above for monolines, as there are
no market observable credit spreads and recovery levels for these
entities. The level of expected loss on CDPC exposures is estimated with
reference to recent market events impacting CDPCs, including
communication activity, and by analysing the underlying trades and the
cost of hedging expected default losses in excess of the capital in each
vehicle.
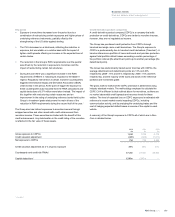
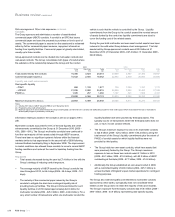
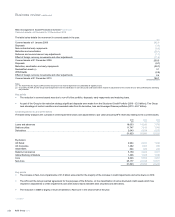
Asummary of the Group's exposure to CDPCs all of which are in Non-
Core is detailed below.
2010
£m
2009
£m
2008
£m
Gross exposure to CDPCs 1,244 1,275 4,776
Credit valuation adjustment (490) (499) (1,311)
Net exposure to CDPCs 754 776 3,465
Credit valuation adjustment as a % of gross exposure 39% 39% 27%
Counterparty and credit risk RWAs*£7.2bn £7.5bn £5.0bn
Capital deductions*£280m £347m —
*unaudited
213RBS Group 2010
Business review
Risk and balance sheet management