RBS 2010 Annual Report Download - page 86
Download and view the complete annual report
Please find page 86 of the 2010 RBS annual report below. You can navigate through the pages in the report by either clicking on the pages listed below, or by using the keyword search tool below to find specific information within the annual report.-
 1
1 -
2
-
3
-
4
-
5
-
6
-
7
-
8
-
9
-
10
-
11
-
12
-
13
-
14
-
15
-
16
-
17
-
18
-
19
-
20
-
21
-
22
-
23
-
24
-
25
-
26
-
27
-
28
-
29
-
30
-
31
-
32
-
33
-
34
-
35
-
36
-
37
-
38
-
39
-
40
-
41
-
42
-
43
-
44
-
45
-
46
-
47
-
48
-
49
-
50
-
51
-
52
-
53
-
54
-
55
-
56
-
57
-
58
-
59
-
60
-
61
-
62
-
63
-
64
-
65
-
66
-
67
-
68
-
69
-
70
-
71
-
72
-
73
-
74
-
75
-
 76
76 -
 77
77 -
 78
78 -
 79
79 -
 80
80 -
 81
81 -
 82
82 -
 83
83 -
 84
84 -
 85
85 -
 86
86 -
 87
87 -
 88
88 -
 89
89 -
 90
90 -
 91
91 -
 92
92 -
 93
93 -
 94
94 -
 95
95 -
 96
96 -
97
-
98
-
99
-
100
-
101
-
102
-
103
-
104
-
105
-
106
-
107
-
108
-
109
-
110
-
111
-
112
-
113
-
114
-
115
-
116
-
117
-
118
-
119
-
120
-
121
-
122
-
123
-
124
-
125
-
126
-
127
-
128
-
129
-
130
-
131
-
132
-
133
-
134
-
135
-
136
-
137
-
138
-
139
-
140
-
141
-
142
-
143
-
144
-
145
-
146
-
147
-
148
-
149
-
150
-
151
-
152
-
153
-
154
-
155
-
156
-
157
-
158
-
159
-
160
-
161
-
162
-
163
-
164
-
165
-
166
-
167
-
168
-
169
-
170
-
171
-
172
-
173
-
174
-
175
-
176
-
177
-
178
-
179
-
180
-
181
-
182
-
183
-
184
-
185
-
186
-
187
-
188
-
189
-
190
-
191
-
192
-
193
-
194
-
195
-
196
-
197
-
198
-
199
-
200
-
201
-
202
-
203
-
204
-
205
-
206
-
207
-
208
-
209
-
210
-
211
-
212
-
213
-
214
-
215
-
216
-
217
-
218
-
219
-
220
-
221
-
222
-
223
-
224
-
225
-
226
-
227
-
228
-
229
-
230
-
231
-
232
-
233
-
234
-
235
-
236
-
237
-
238
-
239
-
240
-
241
-
242
-
243
-
244
-
245
-
246
-
247
-
248
-
249
-
250
-
251
-
252
-
253
-
254
-
255
-
256
-
257
-
258
-
259
-
260
-
261
-
262
-
263
-
264
-
265
-
266
-
267
-
268
-
269
-
270
-
271
-
272
-
273
-
274
-
275
-
276
-
277
-
278
-
279
-
280
-
281
-
282
-
283
-
284
-
285
-
286
-
287
-
288
-
289
-
290
-
291
-
292
-
293
-
294
-
295
-
296
-
297
-
298
-
299
-
300
-
301
-
302
-
303
-
304
-
305
-
306
-
307
-
308
-
309
-
310
-
311
-
312
-
313
-
314
-
315
-
316
-
317
-
318
-
319
-
320
-
321
-
322
-
323
-
324
-
325
-
326
-
327
-
328
-
329
-
330
-
331
-
332
-
333
-
334
-
335
-
336
-
337
-
338
-
339
-
340
-
341
-
342
-
343
-
344
-
345
-
346
-
347
-
348
-
349
-
350
-
351
-
352
-
353
-
354
-
355
-
356
-
357
-
358
-
359
-
360
-
361
-
362
-
363
-
364
-
365
-
366
-
367
-
368
-
369
-
370
-
371
-
372
-
373
-
374
-
375
-
376
-
377
-
378
-
379
-
380
-
381
-
382
-
383
-
384
-
385
-
386
-
387
-
388
-
389
-
390
-
391
-
392
-
393
-
394
-
395
-
396
-
397
-
398
-
399
-
400
-
401
-
402
-
403
-
404
-
405
-
406
-
407
-
408
-
409
-
410
-
411
-
412
-
413
-
414
-
415
-
416
-
417
-
418
-
419
-
420
-
421
-
422
-
423
-
424
-
425
-
426
-
427
-
428
-
429
-
430
-
431
-
432
-
433
-
434
-
435
-
436
-
437
-
438
-
439
-
440
-
441
-
442
-
443
-
444
-
445
 |
 |

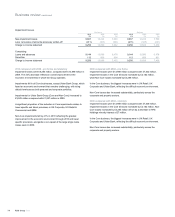
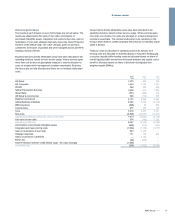
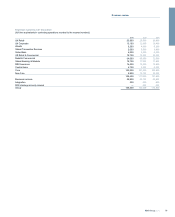
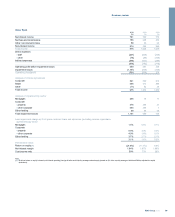
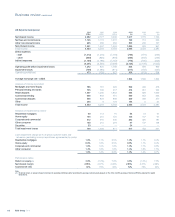
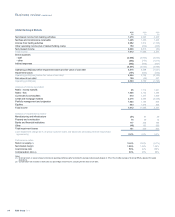
UK Corporate continued
2010 2009 2008
£bn £bn £bn
Capital and balance sheet
Total third party assets 114.6 114.9 121.0
Loans and advances to customers (gross)
- banks and financial institutions 6.1 6.3 5.4
- hotels and restaurants 6.8 6.7 6.1
- housebuilding and construction 4.5 4.3 5.2
- manufacturing 5.3 5.9 5.3
- other 31.0 29.9 38.1
- private sector education, health, social work, recreational and community services 9.0 6.5 7.4
- property 29.5 33.0 31.8
- wholesale and retail trade, repairs 9.6 10.2 9.1
- asset and invoice finance 9.9 8.8 8.5
111.7 111.6 116.9
Customer deposits 100.0 87.8 82.0
Risk elements in lending 4.0 2.3 1.3
Loan:deposit ratio (excluding repos) 110% 126% 142%
Risk-weighted assets 81.4 90.2 85.7
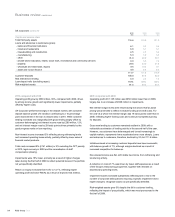
2010 compared with 2009
Operating profit grew by £338 million, 30%, compared with 2009, driven
by strong income growth and significantly lower impairments, partially
offset by higher costs.
UK Corporate performed strongly in the deposit market, with customer
deposit balance growth of £12 billion contributing to a 16 percentage
point improvement in the loan to deposit ratio in 2010. While customer
lending increased only marginally (with gross lending largely offset by
customer deleveraging) net interest income rose by £280 million, 12%,
and net interest margin rose by 29 basis points driven primarily by the
good progress made on loan repricing.
Non-interest income increased 3% reflecting strong refinancing levels
and increased operating lease activity, partially offset by lower sales of
financial market products.
Total costs increased 9% (£141 million) or 5% excluding the OFT penalty
in 2010, legal recovery in 2009 and the normalisation of staff
compensation phasing.
Impairments were 18% lower, primarily as a result of higher charges
taken during the first half of 2009 to reflect potential losses in the portfolio
not yet specifically identified.
Return on equity increased from 9.4% to 12.1%, reflecting higher
operating profit and lower RWAs as a result of improved risk metrics.
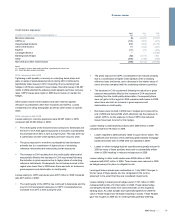
2009 compared with 2008
Operating profit of £1,125 million was £656 million lower than in 2008,
largely due to an increase of £608 million in impairments.
Net interest margin levels were rebuilt during the second half as asset
pricing was amended to reflect increased funding and credit costs. For
the year as a whole net interest margin was 18 basis points lower than in
2008, reflecting higher funding costs and continued competitive pricing
for deposits.
Gross new lending to customers remained resilient in 2009, with a
noticeable acceleration of lending activity in the second half of the year.
However, as customers have deleveraged and turned increasingly to
capital markets, repayments have accelerated even more sharply. Loans
and advances to customers, therefore, declined by 5% to £111.6 billion.
Initiatives aimed at increasing customer deposits have been successful,
with balance growth of 7%, although margins declined as a result of
increased competition for balances.
Non-interest income was flat, with stable fee income from refinancing and
structuring activity.
Areduction in costs of 7% was driven by lower staff expenses as a result
of the Group's restructuring programme, together with restraint on
discretionary spending levels.
Impairment losses increased substantially reflecting both a rise in the
number of corporate delinquencies requiring a specific impairment and a
higher charge to recognise losses not yet specifically identified.
Risk-weighted assets grew 5% despite the fall in customer lending,
reflecting the impact of procyclicality, which was most pronounced in the
first half of 2009.
RBS Group 201084
Business review continued