RBS 2010 Annual Report Download - page 163
Download and view the complete annual report
Please find page 163 of the 2010 RBS annual report below. You can navigate through the pages in the report by either clicking on the pages listed below, or by using the keyword search tool below to find specific information within the annual report.-
 1
1 -
2
-
3
-
4
-
5
-
6
-
7
-
8
-
9
-
10
-
11
-
12
-
13
-
14
-
15
-
16
-
17
-
18
-
19
-
20
-
21
-
22
-
23
-
24
-
25
-
26
-
27
-
28
-
29
-
30
-
31
-
32
-
33
-
34
-
35
-
36
-
37
-
38
-
39
-
40
-
41
-
42
-
43
-
44
-
45
-
46
-
47
-
48
-
49
-
50
-
51
-
52
-
53
-
54
-
55
-
56
-
57
-
58
-
59
-
60
-
61
-
62
-
63
-
64
-
65
-
66
-
67
-
68
-
69
-
70
-
71
-
72
-
73
-
74
-
75
-
76
-
77
-
78
-
79
-
80
-
81
-
82
-
83
-
84
-
85
-
86
-
87
-
88
-
89
-
90
-
91
-
92
-
93
-
94
-
95
-
96
-
97
-
98
-
99
-
100
-
101
-
102
-
103
-
104
-
105
-
106
-
107
-
108
-
109
-
110
-
111
-
112
-
113
-
114
-
115
-
116
-
117
-
118
-
119
-
120
-
121
-
122
-
123
-
124
-
125
-
126
-
127
-
128
-
129
-
130
-
131
-
132
-
133
-
134
-
135
-
136
-
137
-
138
-
139
-
140
-
141
-
142
-
143
-
144
-
145
-
146
-
147
-
148
-
149
-
150
-
151
-
152
-
 153
153 -
 154
154 -
 155
155 -
 156
156 -
 157
157 -
 158
158 -
 159
159 -
 160
160 -
 161
161 -
 162
162 -
 163
163 -
 164
164 -
 165
165 -
 166
166 -
 167
167 -
 168
168 -
 169
169 -
 170
170 -
 171
171 -
 172
172 -
 173
173 -
174
-
175
-
176
-
177
-
178
-
179
-
180
-
181
-
182
-
183
-
184
-
185
-
186
-
187
-
188
-
189
-
190
-
191
-
192
-
193
-
194
-
195
-
196
-
197
-
198
-
199
-
200
-
201
-
202
-
203
-
204
-
205
-
206
-
207
-
208
-
209
-
210
-
211
-
212
-
213
-
214
-
215
-
216
-
217
-
218
-
219
-
220
-
221
-
222
-
223
-
224
-
225
-
226
-
227
-
228
-
229
-
230
-
231
-
232
-
233
-
234
-
235
-
236
-
237
-
238
-
239
-
240
-
241
-
242
-
243
-
244
-
245
-
246
-
247
-
248
-
249
-
250
-
251
-
252
-
253
-
254
-
255
-
256
-
257
-
258
-
259
-
260
-
261
-
262
-
263
-
264
-
265
-
266
-
267
-
268
-
269
-
270
-
271
-
272
-
273
-
274
-
275
-
276
-
277
-
278
-
279
-
280
-
281
-
282
-
283
-
284
-
285
-
286
-
287
-
288
-
289
-
290
-
291
-
292
-
293
-
294
-
295
-
296
-
297
-
298
-
299
-
300
-
301
-
302
-
303
-
304
-
305
-
306
-
307
-
308
-
309
-
310
-
311
-
312
-
313
-
314
-
315
-
316
-
317
-
318
-
319
-
320
-
321
-
322
-
323
-
324
-
325
-
326
-
327
-
328
-
329
-
330
-
331
-
332
-
333
-
334
-
335
-
336
-
337
-
338
-
339
-
340
-
341
-
342
-
343
-
344
-
345
-
346
-
347
-
348
-
349
-
350
-
351
-
352
-
353
-
354
-
355
-
356
-
357
-
358
-
359
-
360
-
361
-
362
-
363
-
364
-
365
-
366
-
367
-
368
-
369
-
370
-
371
-
372
-
373
-
374
-
375
-
376
-
377
-
378
-
379
-
380
-
381
-
382
-
383
-
384
-
385
-
386
-
387
-
388
-
389
-
390
-
391
-
392
-
393
-
394
-
395
-
396
-
397
-
398
-
399
-
400
-
401
-
402
-
403
-
404
-
405
-
406
-
407
-
408
-
409
-
410
-
411
-
412
-
413
-
414
-
415
-
416
-
417
-
418
-
419
-
420
-
421
-
422
-
423
-
424
-
425
-
426
-
427
-
428
-
429
-
430
-
431
-
432
-
433
-
434
-
435
-
436
-
437
-
438
-
439
-
440
-
441
-
442
-
443
-
444
-
445
 |
 |

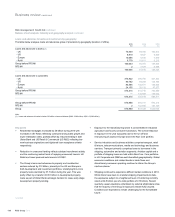
Ulster Bank Group (Core and Non-Core)*
Ulster Bank Group accounts for 8% of the Group’s total credit risk assets
or 7% of the Group’s Core credit risk assets. The Irish economy has
experienced severe economic headwinds resulting in a substantial rise in
unemployment and a steep property value correction over the last two
years. Ulster Bank Group has not been immune to the downturn which
has resulted in a significant migration of credit quality to lower grades and
asubstantial increase in loan impairments. Ulster Bank Group’s
commercial real estate and mortgage portfolios have been acutely
affected and these account for 81% of the 2010 impairment charges
(2009 - 75%).
Core
Impairment charges increased by£512 million at 31 December 2009 to
£1,161 million at 31 December 2010, reflecting the deteriorating
economic environment in Ireland with rising default levels across both
personal and corporate portfolios. Lower asset values, particularly
property related, together with pressure on borrowers with a dependence
on consumer spending have resulted in higher corporate loan losses
while higher unemployment, lower incomes and increased taxation have
driven mortgage impairment increases. Ulster Bank Group is helping
customers in this difficult environment. Forbearance policies which are
deployed through the 'Flex' initiative are aimed at assisting customers in
financial difficulty. These policies have been reviewed in 2010 given the
structural problem that exist in Ireland with the scale and duration of
customers in financial difficulty. The industry definition in the Republic of
Ireland of an unsustainable mortgage (18 months accumulated interest)
has been used to underpin the policy which will improve identification of
customers where forbearance may not be appropriate. The forbearance
portfolios account for 5.8% (7,383 mortgages) of the Ulster Bank Group
mortgage portfolio (by value) at 31 December 2010 with 75% of these
customers (by value) in amortising or interest only agreements.
Non-Core
Impairment charges increased from£1,277 million at 31 December 2009
to £2,682 million at 31 December 2010, reflecting the deteriorating
economic environment in Ireland with rising default levels across the
portfolio. Lower asset values, in property related lending and most
specifically in development lending have resulted in higher corporate loan
losses.
In the third quarter of 2010, £6.1 billion of residential mortgages and
some corporate exposures were transferred from Non-Core to Core; at
the same time £5 billion of commercial real estate loans were transferred
from Core to Non-Core.
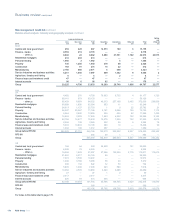
Credit risk assets by industry and geography
Credit risk assets include £51 billion and £3 billion of lending to customers and financial institutions respectively, with the remaining exposure company
RRM and contingent obligations.
Republic of Ireland UK Other Total
Core
Non-
Core Total Core
Non-
Core Total Core
Non-
Core Total Core
Non-
Core Total
Industry sector (1) £m £m £m £m £m £m £m £m £m £m £m £m
2010
Personal 20,064 120 20,184 2,730 22 2,752 5 — 5 22,799 142 22,941
Banks 107 — 107 3 — 3 14 — 14 124 — 124
Non-banks and financial
institutions 167 88 255 46 24 70 4 — 4 217 112 329
Sovereign (2) 2,174 — 2,174 672 — 672 — — — 2,846 — 2,846
Property 3,609 8,431 12,040 2,704 4,281 6,985 305 770 1,075 6,618 13,482 20,100
Retail and leisure 1,923 608 2,531 795 75 870 108 — 108 2,826 683 3,509
Other Corporate 4,033 338 4,371 1,089 88 1,177 198 — 198 5,320 426 5,746
32,077 9,585 41,662 8,039 4,490 12,529 634 770 1,404 40,750 14,845 55,595
2009
Personal 16,008 6,302 22,310 2,782 24 2,806 4 — 4 18,794 6,326 25,120
Banks 99 — 99 4 — 4 28 — 28 131 — 131
Non-banks and financial
institutions 190 19 209 170 16 186 3 — 3 363 35 398
Sovereign (2) 1,909 — 1,909 347 — 347 — — — 2,256 — 2,256
Property 6,686 5,852 12,538 4,540 2,635 7,175 759 413 1,172 11,985 8,900 20,885
Retail and leisure 2,638 288 2,926 579 22 601 126 — 126 3,343 310 3,653
Other Corporate 4,145 228 4,373 894 72 966 131 — 131 5,170 300 5,470
31,675 12,689 44,364 9,316 2,769 12,085 1,051 413 1,464 42,042 15,871 57,913
Notes:
(1) In the third quarter of 2010, £6.1 billion of residential mortgages and some corporate exposures were transferred from Non-Core; at the same time £5 billion of commercial real estate loans were
transferred from Core to Non-Core.
(2) Includes central bank exposures.
161RBS Group 2010
Business review
Risk and balance sheet management