RBS 2010 Annual Report Download - page 142
Download and view the complete annual report
Please find page 142 of the 2010 RBS annual report below. You can navigate through the pages in the report by either clicking on the pages listed below, or by using the keyword search tool below to find specific information within the annual report.-
 1
1 -
2
-
3
-
4
-
5
-
6
-
7
-
8
-
9
-
10
-
11
-
12
-
13
-
14
-
15
-
16
-
17
-
18
-
19
-
20
-
21
-
22
-
23
-
24
-
25
-
26
-
27
-
28
-
29
-
30
-
31
-
32
-
33
-
34
-
35
-
36
-
37
-
38
-
39
-
40
-
41
-
42
-
43
-
44
-
45
-
46
-
47
-
48
-
49
-
50
-
51
-
52
-
53
-
54
-
55
-
56
-
57
-
58
-
59
-
60
-
61
-
62
-
63
-
64
-
65
-
66
-
67
-
68
-
69
-
70
-
71
-
72
-
73
-
74
-
75
-
76
-
77
-
78
-
79
-
80
-
81
-
82
-
83
-
84
-
85
-
86
-
87
-
88
-
89
-
90
-
91
-
92
-
93
-
94
-
95
-
96
-
97
-
98
-
99
-
100
-
101
-
102
-
103
-
104
-
105
-
106
-
107
-
108
-
109
-
110
-
111
-
112
-
113
-
114
-
115
-
116
-
117
-
118
-
119
-
120
-
121
-
122
-
123
-
124
-
125
-
126
-
127
-
128
-
129
-
130
-
131
-
 132
132 -
 133
133 -
 134
134 -
 135
135 -
 136
136 -
 137
137 -
 138
138 -
 139
139 -
 140
140 -
 141
141 -
 142
142 -
 143
143 -
 144
144 -
 145
145 -
 146
146 -
 147
147 -
 148
148 -
 149
149 -
 150
150 -
 151
151 -
 152
152 -
153
-
154
-
155
-
156
-
157
-
158
-
159
-
160
-
161
-
162
-
163
-
164
-
165
-
166
-
167
-
168
-
169
-
170
-
171
-
172
-
173
-
174
-
175
-
176
-
177
-
178
-
179
-
180
-
181
-
182
-
183
-
184
-
185
-
186
-
187
-
188
-
189
-
190
-
191
-
192
-
193
-
194
-
195
-
196
-
197
-
198
-
199
-
200
-
201
-
202
-
203
-
204
-
205
-
206
-
207
-
208
-
209
-
210
-
211
-
212
-
213
-
214
-
215
-
216
-
217
-
218
-
219
-
220
-
221
-
222
-
223
-
224
-
225
-
226
-
227
-
228
-
229
-
230
-
231
-
232
-
233
-
234
-
235
-
236
-
237
-
238
-
239
-
240
-
241
-
242
-
243
-
244
-
245
-
246
-
247
-
248
-
249
-
250
-
251
-
252
-
253
-
254
-
255
-
256
-
257
-
258
-
259
-
260
-
261
-
262
-
263
-
264
-
265
-
266
-
267
-
268
-
269
-
270
-
271
-
272
-
273
-
274
-
275
-
276
-
277
-
278
-
279
-
280
-
281
-
282
-
283
-
284
-
285
-
286
-
287
-
288
-
289
-
290
-
291
-
292
-
293
-
294
-
295
-
296
-
297
-
298
-
299
-
300
-
301
-
302
-
303
-
304
-
305
-
306
-
307
-
308
-
309
-
310
-
311
-
312
-
313
-
314
-
315
-
316
-
317
-
318
-
319
-
320
-
321
-
322
-
323
-
324
-
325
-
326
-
327
-
328
-
329
-
330
-
331
-
332
-
333
-
334
-
335
-
336
-
337
-
338
-
339
-
340
-
341
-
342
-
343
-
344
-
345
-
346
-
347
-
348
-
349
-
350
-
351
-
352
-
353
-
354
-
355
-
356
-
357
-
358
-
359
-
360
-
361
-
362
-
363
-
364
-
365
-
366
-
367
-
368
-
369
-
370
-
371
-
372
-
373
-
374
-
375
-
376
-
377
-
378
-
379
-
380
-
381
-
382
-
383
-
384
-
385
-
386
-
387
-
388
-
389
-
390
-
391
-
392
-
393
-
394
-
395
-
396
-
397
-
398
-
399
-
400
-
401
-
402
-
403
-
404
-
405
-
406
-
407
-
408
-
409
-
410
-
411
-
412
-
413
-
414
-
415
-
416
-
417
-
418
-
419
-
420
-
421
-
422
-
423
-
424
-
425
-
426
-
427
-
428
-
429
-
430
-
431
-
432
-
433
-
434
-
435
-
436
-
437
-
438
-
439
-
440
-
441
-
442
-
443
-
444
-
445
 |
 |

Balance sheet management: Funding and liquidity risk continued
Funding and liquidity metrics continued
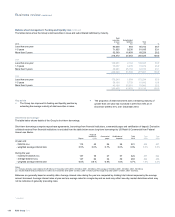
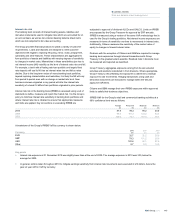
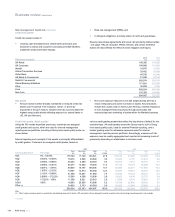
The table below shows the Group’s loan to deposit ratio and customer funding gap.
Loan to deposit ratio (1)
Group
%
Core
%
Customer
funding gap (1)
Group
£bn
2010 117 96 74
2009 135 104 142
2008 151 118 233
Note:
(1) Excludes repurchase agreements, bancassurance deposits to 31 March 2010 and loans are net of provisions. For Group before RFS MI only.
Key points
xThe Group’s loan to deposit ratio improved significantly by 1800
basis points to 117% at 31 December 2010 and the funding gap
narrowed by £68 billion over the year to £74 billion at 31 December
2010, due primarily to a reduction in Non-Core customer loans and
increased customer deposits.
xThe loan to deposit ratio for the Group’s Core business at 31
December 2010 improved to 96% from 104% at 31 December 2009.
xIt is a strategic objective to improve the Group’s loan to deposit ratio
to 100%, or better, by 2013.
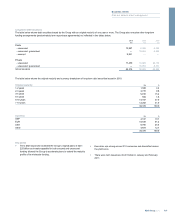
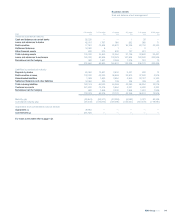
Assets and liabilities by contractual cashflow maturity
The table belowshows the contractual undiscounted cash flows
receivable and payable up to a period of twenty years including future
receipts and payments of interest of on-balance sheet assets by
contractual maturity. The balances in the table below do not agree
directly to the consolidated balance sheet, as the table includes all cash
flows relating to principal and future coupon payments presented on an
undiscounted basis.
0-3 months 3-12 months 1-3 years 3-5 years 5-10 years 10-20 years
2010 £m £m £m £m £m £m
Assets by contractual maturity
Cash and balances at central banks 56,988 — — 1 — 25
Loans and advances to banks 33,809 1,377 711 120 193 79
Debt securities 11,247 9,816 25,059 22,400 40,600 22,128
Settlement balances 11,334 231 — — 41 —
Other financial assets 458 221 207 15 405 —
Total maturing assets 113,836 11,645 25,977 22,536 41,239 22,232
Loans and advances to customers 112,465 86,592 120,139 69,304 78,131 63,015
Derivatives held for hedging 530 1,588 2,612 638 210 101
226,831 99,825 148,728 92,478 119,580 85,348
Liabilities by contractual maturity
Deposits by banks 43,396 4,417 1,243 304 651 374
Debt securities in issue 89,583 43,032 31,862 22,569 24,209 6,697
Subordinated liabilities 2,485 2,611 6,570 8,691 8,672 4,607
Settlement balances and other liabilities 12,423 59 136 177 385 25
Total maturing liabilities 147,887 50,119 39,811 31,741 33,917 11,703
Customer accounts 402,457 18,580 8,360 4,651 4,393 2,384
Derivatives held for hedging 608 936 2,103 969 681 253
550,952 69,635 50,274 37,361 38,991 14,340
Maturity gap (34,051) (38,474) (13,834) (9,205) 7,322 10,529
Cumulative maturity gap (34,051) (72,525) (86,359) (95,564) (88,242) (77,713)
Guarantees and commitments notional amount
Guarantees (1) 31,026 — — — — —
Commitments (2) 266,822 — — — — —
For notes to this table refer to page 142.
RBS Group 2010140
Business review continued