RBS 2010 Annual Report Download - page 213
Download and view the complete annual report
Please find page 213 of the 2010 RBS annual report below. You can navigate through the pages in the report by either clicking on the pages listed below, or by using the keyword search tool below to find specific information within the annual report.-
 1
1 -
2
-
3
-
4
-
5
-
6
-
7
-
8
-
9
-
10
-
11
-
12
-
13
-
14
-
15
-
16
-
17
-
18
-
19
-
20
-
21
-
22
-
23
-
24
-
25
-
26
-
27
-
28
-
29
-
30
-
31
-
32
-
33
-
34
-
35
-
36
-
37
-
38
-
39
-
40
-
41
-
42
-
43
-
44
-
45
-
46
-
47
-
48
-
49
-
50
-
51
-
52
-
53
-
54
-
55
-
56
-
57
-
58
-
59
-
60
-
61
-
62
-
63
-
64
-
65
-
66
-
67
-
68
-
69
-
70
-
71
-
72
-
73
-
74
-
75
-
76
-
77
-
78
-
79
-
80
-
81
-
82
-
83
-
84
-
85
-
86
-
87
-
88
-
89
-
90
-
91
-
92
-
93
-
94
-
95
-
96
-
97
-
98
-
99
-
100
-
101
-
102
-
103
-
104
-
105
-
106
-
107
-
108
-
109
-
110
-
111
-
112
-
113
-
114
-
115
-
116
-
117
-
118
-
119
-
120
-
121
-
122
-
123
-
124
-
125
-
126
-
127
-
128
-
129
-
130
-
131
-
132
-
133
-
134
-
135
-
136
-
137
-
138
-
139
-
140
-
141
-
142
-
143
-
144
-
145
-
146
-
147
-
148
-
149
-
150
-
151
-
152
-
153
-
154
-
155
-
156
-
157
-
158
-
159
-
160
-
161
-
162
-
163
-
164
-
165
-
166
-
167
-
168
-
169
-
170
-
171
-
172
-
173
-
174
-
175
-
176
-
177
-
178
-
179
-
180
-
181
-
182
-
183
-
184
-
185
-
186
-
187
-
188
-
189
-
190
-
191
-
192
-
193
-
194
-
195
-
196
-
197
-
198
-
199
-
200
-
201
-
202
-
 203
203 -
 204
204 -
 205
205 -
 206
206 -
 207
207 -
 208
208 -
 209
209 -
 210
210 -
 211
211 -
 212
212 -
 213
213 -
 214
214 -
 215
215 -
 216
216 -
 217
217 -
 218
218 -
 219
219 -
 220
220 -
 221
221 -
 222
222 -
 223
223 -
224
-
225
-
226
-
227
-
228
-
229
-
230
-
231
-
232
-
233
-
234
-
235
-
236
-
237
-
238
-
239
-
240
-
241
-
242
-
243
-
244
-
245
-
246
-
247
-
248
-
249
-
250
-
251
-
252
-
253
-
254
-
255
-
256
-
257
-
258
-
259
-
260
-
261
-
262
-
263
-
264
-
265
-
266
-
267
-
268
-
269
-
270
-
271
-
272
-
273
-
274
-
275
-
276
-
277
-
278
-
279
-
280
-
281
-
282
-
283
-
284
-
285
-
286
-
287
-
288
-
289
-
290
-
291
-
292
-
293
-
294
-
295
-
296
-
297
-
298
-
299
-
300
-
301
-
302
-
303
-
304
-
305
-
306
-
307
-
308
-
309
-
310
-
311
-
312
-
313
-
314
-
315
-
316
-
317
-
318
-
319
-
320
-
321
-
322
-
323
-
324
-
325
-
326
-
327
-
328
-
329
-
330
-
331
-
332
-
333
-
334
-
335
-
336
-
337
-
338
-
339
-
340
-
341
-
342
-
343
-
344
-
345
-
346
-
347
-
348
-
349
-
350
-
351
-
352
-
353
-
354
-
355
-
356
-
357
-
358
-
359
-
360
-
361
-
362
-
363
-
364
-
365
-
366
-
367
-
368
-
369
-
370
-
371
-
372
-
373
-
374
-
375
-
376
-
377
-
378
-
379
-
380
-
381
-
382
-
383
-
384
-
385
-
386
-
387
-
388
-
389
-
390
-
391
-
392
-
393
-
394
-
395
-
396
-
397
-
398
-
399
-
400
-
401
-
402
-
403
-
404
-
405
-
406
-
407
-
408
-
409
-
410
-
411
-
412
-
413
-
414
-
415
-
416
-
417
-
418
-
419
-
420
-
421
-
422
-
423
-
424
-
425
-
426
-
427
-
428
-
429
-
430
-
431
-
432
-
433
-
434
-
435
-
436
-
437
-
438
-
439
-
440
-
441
-
442
-
443
-
444
-
445
 |
 |

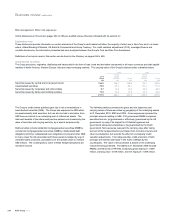
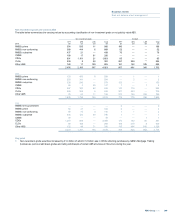
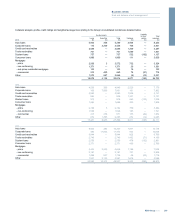
Credit valuation adjustments (CVA)
CVA represents an estimate of the adjustment to arrive at fair value that a market participant would make to incorporate the credit risk inherent in
counterparty derivative exposures.
The table below details the Group’s CVA by type of counterparty.
2010
£m
2009
£m
2008
£m
Monoline insurers 2,443 3,796 5,988
CDPCs 490 499 1,311
Other counterparties 1,714 1,588 1,738
4,647 5,883 9,037
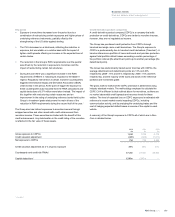
Monoline insurers
The Group has purchased protection from monoline insurers
(“monolines”), mainly against specific ABS. Monolines specialise in
providing credit protection against the principal and interest cash flows
due to the holders of debt instruments in the event of default by the debt
instrument counterparty. This protection is typically held in the form of
derivatives such as credit default swaps (CDSs) referencing underlying
exposures held directly or synthetically by the Group.
The gross mark-to-market of the monoline protection depends on the
value of the instruments against which protection has been bought. A
positive fair value, or a valuation gain, in the protection is recognised if
the fair value of the instrument it references decreases. For the majority
of trades the gross mark-to-market of the monoline protection is
determined directly from the fair value price of the underlying reference
instrument, however for the remainder of the trades, the gross mark-to-
market is determined using industry standard models.
The methodology employed to calculate the monoline CVA uses market
implied probability of defaults and internally assessed recovery levels to
determine the level of expected loss on monoline exposures of different
maturities. The probability of default is calculated with reference to
market observable credit spreads and recovery levels. CVA is calculated
at a trade level by applying the expected loss, corresponding to each
trade’s expected maturity, to the gross mark-to-market of the monoline
protection. The expected maturity of each trade reflects the scheduled
notional amortisation of the underlying reference instruments and
whether payments due from the monoline are received at the point of
default or over the life of the underlying reference instruments.
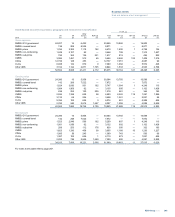
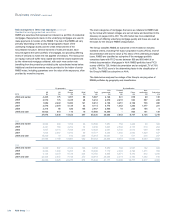
The table below summarises the Group's exposure to monolines, all of
which are in Non-Core.
2010
£m
2009
£m
2008
£m
Gross exposure to monolines 4,023 6,170 11,581
Hedges with financial institutions (71) (531) (789)
Credit valuation adjustment (2,443) (3,796) (5,988)
Net exposure to monolines 1,509 1,843 4,804
Credit valuation adjustment as a % of gross exposure 61% 62% 52%
Counterparty and credit risk RWAs*£17.8bn £13.7bn £7.3bn
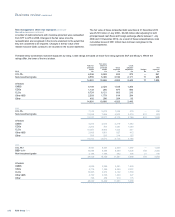
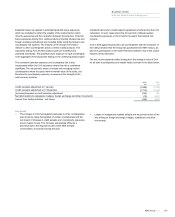
The net income statement effect relating to monoline exposures is detailed below.
2010 2009 2008
£m £m £m
Credit valuation adjustment at 1 January (3,796) (5,988) (862)
Credit valuation adjustment at 31 December (2,443) (3,796) (5,988)
Decrease/(increase) in credit valuation adjustment 1,353 2,192 (5,126)
Net debit relating to realisations, hedges, foreign exchange and other movements (844) (3,290) (347)
Net (debit)/credit relating to reclassified debt securities (305) (1,468) 1,916
Net credit/(debit) to income statement (1) 204 (2,566) (3,557)
Note:
(1) Comprises the following elements for the year ended 2010 and 2009:
- a loss of £5 million (2009 - £2,387 million) in income from trading activities;
-impairment reversals/(losses) of £71 million (2009 - (£239) million); and
-other income of £138 million (2009 - £60 million) relating to reclassified debt securities.
*unaudited
211RBS Group 2010
Business review
Risk and balance sheet management