RBS 2010 Annual Report Download - page 327
Download and view the complete annual report
Please find page 327 of the 2010 RBS annual report below. You can navigate through the pages in the report by either clicking on the pages listed below, or by using the keyword search tool below to find specific information within the annual report.-
 1
1 -
2
-
3
-
4
-
5
-
6
-
7
-
8
-
9
-
10
-
11
-
12
-
13
-
14
-
15
-
16
-
17
-
18
-
19
-
20
-
21
-
22
-
23
-
24
-
25
-
26
-
27
-
28
-
29
-
30
-
31
-
32
-
33
-
34
-
35
-
36
-
37
-
38
-
39
-
40
-
41
-
42
-
43
-
44
-
45
-
46
-
47
-
48
-
49
-
50
-
51
-
52
-
53
-
54
-
55
-
56
-
57
-
58
-
59
-
60
-
61
-
62
-
63
-
64
-
65
-
66
-
67
-
68
-
69
-
70
-
71
-
72
-
73
-
74
-
75
-
76
-
77
-
78
-
79
-
80
-
81
-
82
-
83
-
84
-
85
-
86
-
87
-
88
-
89
-
90
-
91
-
92
-
93
-
94
-
95
-
96
-
97
-
98
-
99
-
100
-
101
-
102
-
103
-
104
-
105
-
106
-
107
-
108
-
109
-
110
-
111
-
112
-
113
-
114
-
115
-
116
-
117
-
118
-
119
-
120
-
121
-
122
-
123
-
124
-
125
-
126
-
127
-
128
-
129
-
130
-
131
-
132
-
133
-
134
-
135
-
136
-
137
-
138
-
139
-
140
-
141
-
142
-
143
-
144
-
145
-
146
-
147
-
148
-
149
-
150
-
151
-
152
-
153
-
154
-
155
-
156
-
157
-
158
-
159
-
160
-
161
-
162
-
163
-
164
-
165
-
166
-
167
-
168
-
169
-
170
-
171
-
172
-
173
-
174
-
175
-
176
-
177
-
178
-
179
-
180
-
181
-
182
-
183
-
184
-
185
-
186
-
187
-
188
-
189
-
190
-
191
-
192
-
193
-
194
-
195
-
196
-
197
-
198
-
199
-
200
-
201
-
202
-
203
-
204
-
205
-
206
-
207
-
208
-
209
-
210
-
211
-
212
-
213
-
214
-
215
-
216
-
217
-
218
-
219
-
220
-
221
-
222
-
223
-
224
-
225
-
226
-
227
-
228
-
229
-
230
-
231
-
232
-
233
-
234
-
235
-
236
-
237
-
238
-
239
-
240
-
241
-
242
-
243
-
244
-
245
-
246
-
247
-
248
-
249
-
250
-
251
-
252
-
253
-
254
-
255
-
256
-
257
-
258
-
259
-
260
-
261
-
262
-
263
-
264
-
265
-
266
-
267
-
268
-
269
-
270
-
271
-
272
-
273
-
274
-
275
-
276
-
277
-
278
-
279
-
280
-
281
-
282
-
283
-
284
-
285
-
286
-
287
-
288
-
289
-
290
-
291
-
292
-
293
-
294
-
295
-
296
-
297
-
298
-
299
-
300
-
301
-
302
-
303
-
304
-
305
-
306
-
307
-
308
-
309
-
310
-
311
-
312
-
313
-
314
-
315
-
316
-
 317
317 -
 318
318 -
 319
319 -
 320
320 -
 321
321 -
 322
322 -
 323
323 -
 324
324 -
 325
325 -
 326
326 -
 327
327 -
 328
328 -
 329
329 -
 330
330 -
 331
331 -
 332
332 -
 333
333 -
 334
334 -
 335
335 -
 336
336 -
 337
337 -
338
-
339
-
340
-
341
-
342
-
343
-
344
-
345
-
346
-
347
-
348
-
349
-
350
-
351
-
352
-
353
-
354
-
355
-
356
-
357
-
358
-
359
-
360
-
361
-
362
-
363
-
364
-
365
-
366
-
367
-
368
-
369
-
370
-
371
-
372
-
373
-
374
-
375
-
376
-
377
-
378
-
379
-
380
-
381
-
382
-
383
-
384
-
385
-
386
-
387
-
388
-
389
-
390
-
391
-
392
-
393
-
394
-
395
-
396
-
397
-
398
-
399
-
400
-
401
-
402
-
403
-
404
-
405
-
406
-
407
-
408
-
409
-
410
-
411
-
412
-
413
-
414
-
415
-
416
-
417
-
418
-
419
-
420
-
421
-
422
-
423
-
424
-
425
-
426
-
427
-
428
-
429
-
430
-
431
-
432
-
433
-
434
-
435
-
436
-
437
-
438
-
439
-
440
-
441
-
442
-
443
-
444
-
445
 |
 |

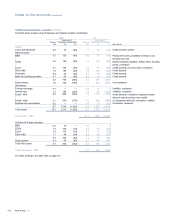
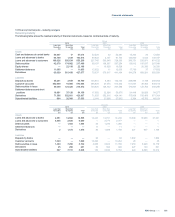
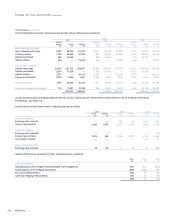
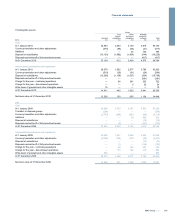
13 Financial instruments - maturity analysis
Remaining maturity
The following table shows the residual maturity of financial instruments, based on contractual date of maturity.
Group
2010 2009 2008
Less than
12 months
More than
12 months Total
Less than
12 months
More than
12 months Total
Less than
12 months
More than
12 months Total
£m £m £m
£m £m £m £m £m £m
Assets
Cash and balances at central banks 56,997 17 57,014
52,229 32 52,261 12,364 36 12,400
Loans and advances to banks 98,789 1,729 100,518 89,622 2,131 91,753 133,565 4,632 138,197
Loans and advances to customers 199,626 355,634 555,260 227,745 500,648 728,393 338,751 535,971 874,722
Debt securities 42,678 174,802 217,480 69,197 198,057 267,254 69,912 197,637 267,549
Equity shares —22,198 22,198 — 19,528 19,528 — 26,330 26,330
Settlement balances 11,605 — 11,605
12,022 11 12,033 17,795 37 17,832
Derivatives 65,639 361,438 427,077 70,537 370,917 441,454 184,278 808,281 992,559
Liabilities
Deposits by banks 95,241 3,549 98,790
135,641 6,503 142,144 248,896 9,148 258,044
Customer accounts 492,609 18,084 510,693 586,628 27,574 614,202 611,047 28,465 639,512
Debt securities in issue 94,048 124,324 218,372 140,826 126,742 267,568 174,507 125,782 300,289
Settlement balances and short
positions 16,981 37,128 54,109 17,952 32,924 50,876 24,448 29,829 54,277
Derivatives 71,306 352,661 423,967 71,625 352,516 424,141 175,908 795,456 971,364
Subordinated liabilities 964 26,089 27,053 2,144 35,508 37,652 3,394 45,760 49,154
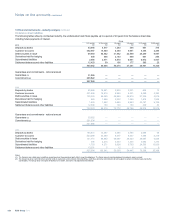
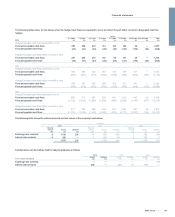
Company
2010 2009 2008
Less than
12 months
More than
12 months Total
Less than
12 months
More than
12 months Total
Less than
12 months
More than
12 months Total
£m £m £m £m £m £m £m £m £m
Assets
Loans and advances to banks 4,651 14,884 19,535 16,447 14,791 31,238 16,096 10,935 27,031
Loans and advances to customers 3,855 2,834 6,689 —2,777 2,777 — — —
Debt securities —1,454 1,454 52 1,234 1,286 — — —
Settlement balances — — — 11 — 11 — — —
Derivatives 21,473 1,475 80 1,089 1,169 221 947 1,168
Liabilities
Deposits by banks — — — 93 — 93 1,802 — 1,802
Customer accounts 1,029 — 1,029
13,264 — 13,264 26 — 26
Debt securities in issue 1,460 7,282 8,742 4,965 6,823 11,788 7,253 6,926 14,179
Derivatives 25 206 231 53 393 446 227 134 361
Subordinated liabilities 307 7,741 8,048 130 8,632 8,762 424 9,890 10,314
325RBS Group 2010
Financial statements