RBS 2010 Annual Report Download - page 217
Download and view the complete annual report
Please find page 217 of the 2010 RBS annual report below. You can navigate through the pages in the report by either clicking on the pages listed below, or by using the keyword search tool below to find specific information within the annual report.-
 1
1 -
2
-
3
-
4
-
5
-
6
-
7
-
8
-
9
-
10
-
11
-
12
-
13
-
14
-
15
-
16
-
17
-
18
-
19
-
20
-
21
-
22
-
23
-
24
-
25
-
26
-
27
-
28
-
29
-
30
-
31
-
32
-
33
-
34
-
35
-
36
-
37
-
38
-
39
-
40
-
41
-
42
-
43
-
44
-
45
-
46
-
47
-
48
-
49
-
50
-
51
-
52
-
53
-
54
-
55
-
56
-
57
-
58
-
59
-
60
-
61
-
62
-
63
-
64
-
65
-
66
-
67
-
68
-
69
-
70
-
71
-
72
-
73
-
74
-
75
-
76
-
77
-
78
-
79
-
80
-
81
-
82
-
83
-
84
-
85
-
86
-
87
-
88
-
89
-
90
-
91
-
92
-
93
-
94
-
95
-
96
-
97
-
98
-
99
-
100
-
101
-
102
-
103
-
104
-
105
-
106
-
107
-
108
-
109
-
110
-
111
-
112
-
113
-
114
-
115
-
116
-
117
-
118
-
119
-
120
-
121
-
122
-
123
-
124
-
125
-
126
-
127
-
128
-
129
-
130
-
131
-
132
-
133
-
134
-
135
-
136
-
137
-
138
-
139
-
140
-
141
-
142
-
143
-
144
-
145
-
146
-
147
-
148
-
149
-
150
-
151
-
152
-
153
-
154
-
155
-
156
-
157
-
158
-
159
-
160
-
161
-
162
-
163
-
164
-
165
-
166
-
167
-
168
-
169
-
170
-
171
-
172
-
173
-
174
-
175
-
176
-
177
-
178
-
179
-
180
-
181
-
182
-
183
-
184
-
185
-
186
-
187
-
188
-
189
-
190
-
191
-
192
-
193
-
194
-
195
-
196
-
197
-
198
-
199
-
200
-
201
-
202
-
203
-
204
-
205
-
206
-
 207
207 -
 208
208 -
 209
209 -
 210
210 -
 211
211 -
 212
212 -
 213
213 -
 214
214 -
 215
215 -
 216
216 -
 217
217 -
 218
218 -
 219
219 -
 220
220 -
 221
221 -
 222
222 -
 223
223 -
 224
224 -
 225
225 -
 226
226 -
 227
227 -
228
-
229
-
230
-
231
-
232
-
233
-
234
-
235
-
236
-
237
-
238
-
239
-
240
-
241
-
242
-
243
-
244
-
245
-
246
-
247
-
248
-
249
-
250
-
251
-
252
-
253
-
254
-
255
-
256
-
257
-
258
-
259
-
260
-
261
-
262
-
263
-
264
-
265
-
266
-
267
-
268
-
269
-
270
-
271
-
272
-
273
-
274
-
275
-
276
-
277
-
278
-
279
-
280
-
281
-
282
-
283
-
284
-
285
-
286
-
287
-
288
-
289
-
290
-
291
-
292
-
293
-
294
-
295
-
296
-
297
-
298
-
299
-
300
-
301
-
302
-
303
-
304
-
305
-
306
-
307
-
308
-
309
-
310
-
311
-
312
-
313
-
314
-
315
-
316
-
317
-
318
-
319
-
320
-
321
-
322
-
323
-
324
-
325
-
326
-
327
-
328
-
329
-
330
-
331
-
332
-
333
-
334
-
335
-
336
-
337
-
338
-
339
-
340
-
341
-
342
-
343
-
344
-
345
-
346
-
347
-
348
-
349
-
350
-
351
-
352
-
353
-
354
-
355
-
356
-
357
-
358
-
359
-
360
-
361
-
362
-
363
-
364
-
365
-
366
-
367
-
368
-
369
-
370
-
371
-
372
-
373
-
374
-
375
-
376
-
377
-
378
-
379
-
380
-
381
-
382
-
383
-
384
-
385
-
386
-
387
-
388
-
389
-
390
-
391
-
392
-
393
-
394
-
395
-
396
-
397
-
398
-
399
-
400
-
401
-
402
-
403
-
404
-
405
-
406
-
407
-
408
-
409
-
410
-
411
-
412
-
413
-
414
-
415
-
416
-
417
-
418
-
419
-
420
-
421
-
422
-
423
-
424
-
425
-
426
-
427
-
428
-
429
-
430
-
431
-
432
-
433
-
434
-
435
-
436
-
437
-
438
-
439
-
440
-
441
-
442
-
443
-
444
-
445
 |
 |

Expected losses are applied to estimated potential future exposures
which are modelled to reflect the volatility of the market factors which
drive the exposures and the correlation between those factors. Potential
future exposures arising from vanilla products (including interest rate and
foreign exchange derivatives) are modelled jointly using the Group's core
counterparty risk systems. The majority of the Group's CVA held in
relation to other counterparties arises on these vanilla products. The
exposures arising from all other product types are modelled and
assessed individually. The potential future exposure to each counterparty
is the aggregate of the exposures arising on the underlying product types.
The correlation between exposure and counterparty risk is also
incorporated within the CVA calculation where this risk is considered
significant. The risk primarily arises on trades with emerging market
counterparties where the gross mark-to-market value of the trade, and
therefore the counterparty exposure, increases as the strength of the
local currency declines.
Collateral held under a credit support agreement is factored into the CVA
calculation. In such cases where the Group holds collateral against
counterparty exposures, CVA is held to the extent that residual risk
remains.
CVA is held against exposures to all counterparties with the exception of
the CDS protection that the Group has purchased from HM Treasury, as
part of its participation in the Asset Protection Scheme, due to the unique
features of this derivative.
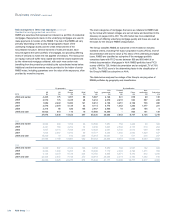
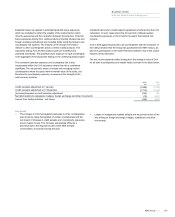
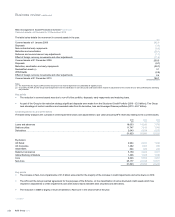
The net income statement effect arising from the change in level of CVA
for all other counterparties and related trades is shown in the table below.
2010 2009
£m £m
Credit valuation adjustment at 1 January (1,588) (1,738)
Credit valuation adjustment at 31 December (1,714) (1,588)
(Increase)/decrease in credit valuation adjustment (126) 150
Net debit relating to realisations, hedges, foreign exchange and other movements (19) (841)
Income from trading activities - net losses (145) (691)
Key points
xThe increase in CVA held against exposures to other counterparties
was driven by rating downgrades of certain counterparties and the
net impact of changes in credit spreads and counterparty exposures
due to market moves. This increase was partially offset by a
decrease due to the disposal of parts of the RBS Sempra
Commodities JV business during the year.
xLosses on hedges and realised defaults are the primary driver of the
loss arising on foreign exchange, hedges, realisations and other
movements.
215RBS Group 2010
Business review
Risk and balance sheet management