RBS 2010 Annual Report Download - page 141
Download and view the complete annual report
Please find page 141 of the 2010 RBS annual report below. You can navigate through the pages in the report by either clicking on the pages listed below, or by using the keyword search tool below to find specific information within the annual report.-
 1
1 -
2
-
3
-
4
-
5
-
6
-
7
-
8
-
9
-
10
-
11
-
12
-
13
-
14
-
15
-
16
-
17
-
18
-
19
-
20
-
21
-
22
-
23
-
24
-
25
-
26
-
27
-
28
-
29
-
30
-
31
-
32
-
33
-
34
-
35
-
36
-
37
-
38
-
39
-
40
-
41
-
42
-
43
-
44
-
45
-
46
-
47
-
48
-
49
-
50
-
51
-
52
-
53
-
54
-
55
-
56
-
57
-
58
-
59
-
60
-
61
-
62
-
63
-
64
-
65
-
66
-
67
-
68
-
69
-
70
-
71
-
72
-
73
-
74
-
75
-
76
-
77
-
78
-
79
-
80
-
81
-
82
-
83
-
84
-
85
-
86
-
87
-
88
-
89
-
90
-
91
-
92
-
93
-
94
-
95
-
96
-
97
-
98
-
99
-
100
-
101
-
102
-
103
-
104
-
105
-
106
-
107
-
108
-
109
-
110
-
111
-
112
-
113
-
114
-
115
-
116
-
117
-
118
-
119
-
120
-
121
-
122
-
123
-
124
-
125
-
126
-
127
-
128
-
129
-
130
-
 131
131 -
 132
132 -
 133
133 -
 134
134 -
 135
135 -
 136
136 -
 137
137 -
 138
138 -
 139
139 -
 140
140 -
 141
141 -
 142
142 -
 143
143 -
 144
144 -
 145
145 -
 146
146 -
 147
147 -
 148
148 -
 149
149 -
 150
150 -
 151
151 -
152
-
153
-
154
-
155
-
156
-
157
-
158
-
159
-
160
-
161
-
162
-
163
-
164
-
165
-
166
-
167
-
168
-
169
-
170
-
171
-
172
-
173
-
174
-
175
-
176
-
177
-
178
-
179
-
180
-
181
-
182
-
183
-
184
-
185
-
186
-
187
-
188
-
189
-
190
-
191
-
192
-
193
-
194
-
195
-
196
-
197
-
198
-
199
-
200
-
201
-
202
-
203
-
204
-
205
-
206
-
207
-
208
-
209
-
210
-
211
-
212
-
213
-
214
-
215
-
216
-
217
-
218
-
219
-
220
-
221
-
222
-
223
-
224
-
225
-
226
-
227
-
228
-
229
-
230
-
231
-
232
-
233
-
234
-
235
-
236
-
237
-
238
-
239
-
240
-
241
-
242
-
243
-
244
-
245
-
246
-
247
-
248
-
249
-
250
-
251
-
252
-
253
-
254
-
255
-
256
-
257
-
258
-
259
-
260
-
261
-
262
-
263
-
264
-
265
-
266
-
267
-
268
-
269
-
270
-
271
-
272
-
273
-
274
-
275
-
276
-
277
-
278
-
279
-
280
-
281
-
282
-
283
-
284
-
285
-
286
-
287
-
288
-
289
-
290
-
291
-
292
-
293
-
294
-
295
-
296
-
297
-
298
-
299
-
300
-
301
-
302
-
303
-
304
-
305
-
306
-
307
-
308
-
309
-
310
-
311
-
312
-
313
-
314
-
315
-
316
-
317
-
318
-
319
-
320
-
321
-
322
-
323
-
324
-
325
-
326
-
327
-
328
-
329
-
330
-
331
-
332
-
333
-
334
-
335
-
336
-
337
-
338
-
339
-
340
-
341
-
342
-
343
-
344
-
345
-
346
-
347
-
348
-
349
-
350
-
351
-
352
-
353
-
354
-
355
-
356
-
357
-
358
-
359
-
360
-
361
-
362
-
363
-
364
-
365
-
366
-
367
-
368
-
369
-
370
-
371
-
372
-
373
-
374
-
375
-
376
-
377
-
378
-
379
-
380
-
381
-
382
-
383
-
384
-
385
-
386
-
387
-
388
-
389
-
390
-
391
-
392
-
393
-
394
-
395
-
396
-
397
-
398
-
399
-
400
-
401
-
402
-
403
-
404
-
405
-
406
-
407
-
408
-
409
-
410
-
411
-
412
-
413
-
414
-
415
-
416
-
417
-
418
-
419
-
420
-
421
-
422
-
423
-
424
-
425
-
426
-
427
-
428
-
429
-
430
-
431
-
432
-
433
-
434
-
435
-
436
-
437
-
438
-
439
-
440
-
441
-
442
-
443
-
444
-
445
 |
 |

Funding and liquidity metrics
The Group continues to improve and augment funding and liquidity risk management practices in light of market experience and emerging regulatory
and industry standards. The Group monitors a range of funding and liquidity indicators for the consolidated Group as well as its principal subsidiaries.
These metrics encompass short and long-term liquidity requirements under stress and normal operating conditions. Two important structural ratios are
described below.
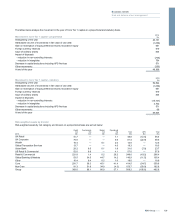
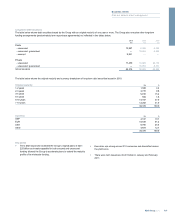
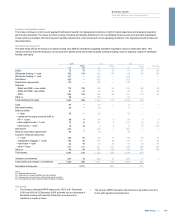
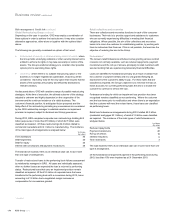
Net stable funding ratio*
The table below shows the Group’s net stable funding ratio (NSFR) estimated by applying the Basel III guidance issued in December 2010. This
measure seeks to show the proportion of structural term assets which are funded by stable funding including customer deposits, long-term wholesale
funding, and equity.
2010 2009 2008
ASF(1) ASF(1) ASF(1) Weighting
£bn £bn £bn £bn £bn £bn %
Equity 76 76 80 80 64 64 100
Wholesale funding > 1 year 154 154 144 144 149 149 100
Wholesale funding < 1 year 157 — 250 — 343 — —
Derivatives 424 — 422 — 969 — —
Repurchase agreements 115 — 106 — 142 — —
Deposits
- Retail and SME - more stable 172 155 166 149 184 166 90
- Retail and SME - less stable 51 41 50 40 55 44 80
- Other 206 103 199 99 221 110 50
Other (2) 98 — 105 — 92 — —
Total liabilities and equity 1,453 529 1,522 512 2,219 533
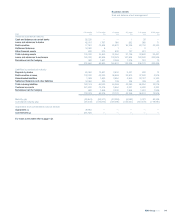
Cash 57 — 52 — 12 — —
Inter-bank lending 58 — 49 — 71 — —
Debt securities:
- < 1year 43 — 69 — 69 — —
- central and local governments AAA to
AA- > 1 year 89 4 84 4 68 3 5
- other eligible bonds > 1 year 75 15 87 17 101 20 20
- other bonds > 1 year 10 10 99 15 15 100
Derivatives 427 — 438 — 991 — —
Reverse repurchase agreements 95 — 76 — 98 — —
Customer loans and advances
- < 1 year 125 63 153 77 190 95 50
- residential mortgages > 1 year 145 94 137 89 170 111 65
- retail loans < 1year 22 19 24 20 30 25 85
- other > 1year 211 211 241 241 298 298 100
Other (3) 96 96 103 103 106 107 100
Total assets 1,453 512 1,522 560 2,219 674
Undrawn commitments 267 13 289 14 347 17 5
Total assets and undrawn commitments 1,720 525 1,811 574 2,566 691
Net stable funding ratio 101% 89% 77%
Notes:
(1) Available stable funding.
(2) Deferred tax, insurance liabilities and other liabilities.
(3) Prepayments, accrued income, deferred tax and other assets.
(4) Prior periods have been revised to reflect the Basel III guidance.
Key points*
xThe Group’s estimated NSFR improved to 101% at 31 December
2010 from 89% at 31 December 2009, primarily due to a decrease in
wholesale funding with maturity of less than one year and a
reduction in customer loans.
xThe Group’s NSFR calculation will continue to be refined over time
in line with regulatory developments.
139RBS Group 2010
Business review
Risk and balance sheet management