RBS 2010 Annual Report Download - page 341
Download and view the complete annual report
Please find page 341 of the 2010 RBS annual report below. You can navigate through the pages in the report by either clicking on the pages listed below, or by using the keyword search tool below to find specific information within the annual report.-
 1
1 -
2
-
3
-
4
-
5
-
6
-
7
-
8
-
9
-
10
-
11
-
12
-
13
-
14
-
15
-
16
-
17
-
18
-
19
-
20
-
21
-
22
-
23
-
24
-
25
-
26
-
27
-
28
-
29
-
30
-
31
-
32
-
33
-
34
-
35
-
36
-
37
-
38
-
39
-
40
-
41
-
42
-
43
-
44
-
45
-
46
-
47
-
48
-
49
-
50
-
51
-
52
-
53
-
54
-
55
-
56
-
57
-
58
-
59
-
60
-
61
-
62
-
63
-
64
-
65
-
66
-
67
-
68
-
69
-
70
-
71
-
72
-
73
-
74
-
75
-
76
-
77
-
78
-
79
-
80
-
81
-
82
-
83
-
84
-
85
-
86
-
87
-
88
-
89
-
90
-
91
-
92
-
93
-
94
-
95
-
96
-
97
-
98
-
99
-
100
-
101
-
102
-
103
-
104
-
105
-
106
-
107
-
108
-
109
-
110
-
111
-
112
-
113
-
114
-
115
-
116
-
117
-
118
-
119
-
120
-
121
-
122
-
123
-
124
-
125
-
126
-
127
-
128
-
129
-
130
-
131
-
132
-
133
-
134
-
135
-
136
-
137
-
138
-
139
-
140
-
141
-
142
-
143
-
144
-
145
-
146
-
147
-
148
-
149
-
150
-
151
-
152
-
153
-
154
-
155
-
156
-
157
-
158
-
159
-
160
-
161
-
162
-
163
-
164
-
165
-
166
-
167
-
168
-
169
-
170
-
171
-
172
-
173
-
174
-
175
-
176
-
177
-
178
-
179
-
180
-
181
-
182
-
183
-
184
-
185
-
186
-
187
-
188
-
189
-
190
-
191
-
192
-
193
-
194
-
195
-
196
-
197
-
198
-
199
-
200
-
201
-
202
-
203
-
204
-
205
-
206
-
207
-
208
-
209
-
210
-
211
-
212
-
213
-
214
-
215
-
216
-
217
-
218
-
219
-
220
-
221
-
222
-
223
-
224
-
225
-
226
-
227
-
228
-
229
-
230
-
231
-
232
-
233
-
234
-
235
-
236
-
237
-
238
-
239
-
240
-
241
-
242
-
243
-
244
-
245
-
246
-
247
-
248
-
249
-
250
-
251
-
252
-
253
-
254
-
255
-
256
-
257
-
258
-
259
-
260
-
261
-
262
-
263
-
264
-
265
-
266
-
267
-
268
-
269
-
270
-
271
-
272
-
273
-
274
-
275
-
276
-
277
-
278
-
279
-
280
-
281
-
282
-
283
-
284
-
285
-
286
-
287
-
288
-
289
-
290
-
291
-
292
-
293
-
294
-
295
-
296
-
297
-
298
-
299
-
300
-
301
-
302
-
303
-
304
-
305
-
306
-
307
-
308
-
309
-
310
-
311
-
312
-
313
-
314
-
315
-
316
-
317
-
318
-
319
-
320
-
321
-
322
-
323
-
324
-
325
-
326
-
327
-
328
-
329
-
330
-
 331
331 -
 332
332 -
 333
333 -
 334
334 -
 335
335 -
 336
336 -
 337
337 -
 338
338 -
 339
339 -
 340
340 -
 341
341 -
 342
342 -
 343
343 -
 344
344 -
 345
345 -
 346
346 -
 347
347 -
 348
348 -
 349
349 -
 350
350 -
 351
351 -
352
-
353
-
354
-
355
-
356
-
357
-
358
-
359
-
360
-
361
-
362
-
363
-
364
-
365
-
366
-
367
-
368
-
369
-
370
-
371
-
372
-
373
-
374
-
375
-
376
-
377
-
378
-
379
-
380
-
381
-
382
-
383
-
384
-
385
-
386
-
387
-
388
-
389
-
390
-
391
-
392
-
393
-
394
-
395
-
396
-
397
-
398
-
399
-
400
-
401
-
402
-
403
-
404
-
405
-
406
-
407
-
408
-
409
-
410
-
411
-
412
-
413
-
414
-
415
-
416
-
417
-
418
-
419
-
420
-
421
-
422
-
423
-
424
-
425
-
426
-
427
-
428
-
429
-
430
-
431
-
432
-
433
-
434
-
435
-
436
-
437
-
438
-
439
-
440
-
441
-
442
-
443
-
444
-
445
 |
 |

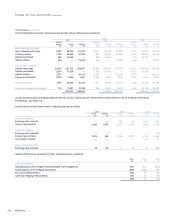
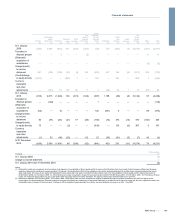
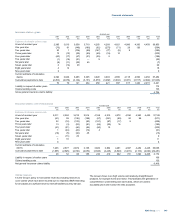
Group
Investment
properties
Freehold
premises
Long
leasehold
premises
Short
leasehold
premises
Computers
and other
equipment
Operating
lease
assets Total
2008 £m £m £m £m £m £m £m
Cost or valuation
At 1 January 2008 3,431 3,645 215 1,688 3,929 11,437 24,345
Transfer to disposal groups —(262) — (188) (349) — (799)
Currency translation and other adjustments 320 452 5 149 436 1,313 2,675
Acquisition of subsidiaries — — — 30 31 — 61
Disposal of subsidiaries — — — (2) (57) (5,015) (5,074)
Reclassifications —(176) — 197 (14) (7) —
Additions 417 486 22 61 837 3,794 5,617
Expenditure on investment properties 8 — — — — — 8
Change in fair value of investment properties (86) — — — — — (86)
Disposals and write-off of fully depreciated assets (222) (113) (18) (68) (645) (2,188) (3,254)
At 31 December 2008 3,868 4,032 224 1,867 4,168 9,334 23,493
Accumulated depreciation and amortisation
At 1 January 2008 —391 74 436 1,952 2,747 5,600
Transfers to disposal groups —(60) — (91) (243) — (394)
Currency translation and other adjustments —(9) 1 9 148 202 351
Disposal of subsidiaries — — — (1) (39) (1,447) (1,487)
Reclassifications —17 (2) 1 (9) (7) —
Write down of property, plant and equipment — 19 — — 7 — 26
Disposals and write-off of fully depreciated assets —(22) — (31) (539) (544) (1,136)
Charge for the year - continuing operations —86 6 139 534 641 1,406
Charge for the year - discontinued operations — — — 30 105 43 178
At 31 December 2008 —422 79 492 1,916 1,635 4,544
Net book value at 31 December 2008 3,868 3,610 145 1,375 2,252 7,699 18,949
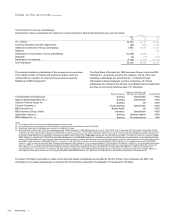
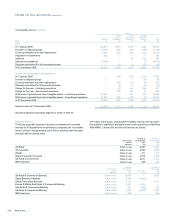
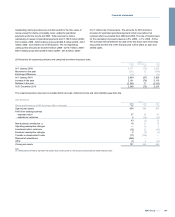
Investment properties are valued to reflect fair value, that is, the market
value of the Group's interest at the reporting date excluding any special
terms or circumstances relating to the use or financing of the property
and transaction costs that would be incurred in making a sale. Observed
market data such as rental yield, replacement cost and useful life, reflect
relatively few transactions involving property that is not necessarily
identical to property owned by the Group.
Valuations are carried out by qualified surveyors who are members of the
Royal Institution of Chartered Surveyors, or an equivalent overseas body.
The valuation as at 31 December 2010 for a significant majority of the
Group's investment properties was undertaken with the support of
external valuers.
The fair value of investment properties includes £248 million of
depreciation since purchase (2009 - £84 million appreciation; 2008 - £172
million appreciation).
Rental income from investment properties was £279 million (2009 - £233
million; 2008 - £257 million). Direct operating expenses of investment
properties were £42 million (2009 - £16 million; 2008 - £22 million).
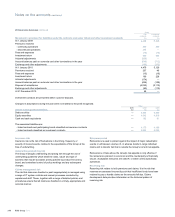
Property, plant and equipment, excluding investment properties, include
£298 million (2009 - £213 million; 2008 - £1,132 million) assets in the
course of construction.
Freehold and long leasehold properties with a net book value of £2
million (2009 - £5 million; 2008 - nil) were sold subject to operating leases.
339RBS Group 2010
Financial statements