RBS 2010 Annual Report Download - page 203
Download and view the complete annual report
Please find page 203 of the 2010 RBS annual report below. You can navigate through the pages in the report by either clicking on the pages listed below, or by using the keyword search tool below to find specific information within the annual report.-
 1
1 -
2
-
3
-
4
-
5
-
6
-
7
-
8
-
9
-
10
-
11
-
12
-
13
-
14
-
15
-
16
-
17
-
18
-
19
-
20
-
21
-
22
-
23
-
24
-
25
-
26
-
27
-
28
-
29
-
30
-
31
-
32
-
33
-
34
-
35
-
36
-
37
-
38
-
39
-
40
-
41
-
42
-
43
-
44
-
45
-
46
-
47
-
48
-
49
-
50
-
51
-
52
-
53
-
54
-
55
-
56
-
57
-
58
-
59
-
60
-
61
-
62
-
63
-
64
-
65
-
66
-
67
-
68
-
69
-
70
-
71
-
72
-
73
-
74
-
75
-
76
-
77
-
78
-
79
-
80
-
81
-
82
-
83
-
84
-
85
-
86
-
87
-
88
-
89
-
90
-
91
-
92
-
93
-
94
-
95
-
96
-
97
-
98
-
99
-
100
-
101
-
102
-
103
-
104
-
105
-
106
-
107
-
108
-
109
-
110
-
111
-
112
-
113
-
114
-
115
-
116
-
117
-
118
-
119
-
120
-
121
-
122
-
123
-
124
-
125
-
126
-
127
-
128
-
129
-
130
-
131
-
132
-
133
-
134
-
135
-
136
-
137
-
138
-
139
-
140
-
141
-
142
-
143
-
144
-
145
-
146
-
147
-
148
-
149
-
150
-
151
-
152
-
153
-
154
-
155
-
156
-
157
-
158
-
159
-
160
-
161
-
162
-
163
-
164
-
165
-
166
-
167
-
168
-
169
-
170
-
171
-
172
-
173
-
174
-
175
-
176
-
177
-
178
-
179
-
180
-
181
-
182
-
183
-
184
-
185
-
186
-
187
-
188
-
189
-
190
-
191
-
192
-
 193
193 -
 194
194 -
 195
195 -
 196
196 -
 197
197 -
 198
198 -
 199
199 -
 200
200 -
 201
201 -
 202
202 -
 203
203 -
 204
204 -
 205
205 -
 206
206 -
 207
207 -
 208
208 -
 209
209 -
 210
210 -
 211
211 -
 212
212 -
 213
213 -
214
-
215
-
216
-
217
-
218
-
219
-
220
-
221
-
222
-
223
-
224
-
225
-
226
-
227
-
228
-
229
-
230
-
231
-
232
-
233
-
234
-
235
-
236
-
237
-
238
-
239
-
240
-
241
-
242
-
243
-
244
-
245
-
246
-
247
-
248
-
249
-
250
-
251
-
252
-
253
-
254
-
255
-
256
-
257
-
258
-
259
-
260
-
261
-
262
-
263
-
264
-
265
-
266
-
267
-
268
-
269
-
270
-
271
-
272
-
273
-
274
-
275
-
276
-
277
-
278
-
279
-
280
-
281
-
282
-
283
-
284
-
285
-
286
-
287
-
288
-
289
-
290
-
291
-
292
-
293
-
294
-
295
-
296
-
297
-
298
-
299
-
300
-
301
-
302
-
303
-
304
-
305
-
306
-
307
-
308
-
309
-
310
-
311
-
312
-
313
-
314
-
315
-
316
-
317
-
318
-
319
-
320
-
321
-
322
-
323
-
324
-
325
-
326
-
327
-
328
-
329
-
330
-
331
-
332
-
333
-
334
-
335
-
336
-
337
-
338
-
339
-
340
-
341
-
342
-
343
-
344
-
345
-
346
-
347
-
348
-
349
-
350
-
351
-
352
-
353
-
354
-
355
-
356
-
357
-
358
-
359
-
360
-
361
-
362
-
363
-
364
-
365
-
366
-
367
-
368
-
369
-
370
-
371
-
372
-
373
-
374
-
375
-
376
-
377
-
378
-
379
-
380
-
381
-
382
-
383
-
384
-
385
-
386
-
387
-
388
-
389
-
390
-
391
-
392
-
393
-
394
-
395
-
396
-
397
-
398
-
399
-
400
-
401
-
402
-
403
-
404
-
405
-
406
-
407
-
408
-
409
-
410
-
411
-
412
-
413
-
414
-
415
-
416
-
417
-
418
-
419
-
420
-
421
-
422
-
423
-
424
-
425
-
426
-
427
-
428
-
429
-
430
-
431
-
432
-
433
-
434
-
435
-
436
-
437
-
438
-
439
-
440
-
441
-
442
-
443
-
444
-
445
 |
 |
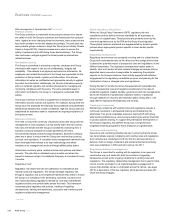
Operational risk metrics
Reporting forms an integral part of operational risk management. The
Group’s risk management processes are designed to ensure that issues
are identified, escalated and managed on a timely basis. Exposures for
each division are reported through monthly risk and control reports, which
provide details on the risk exposures and action plans. Events that have
amaterial, actual or potential impact on the Group’s finances, reputation
or customers, are escalated and reported to divisional and Group
executives.
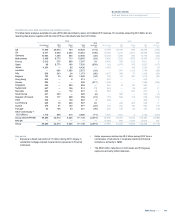
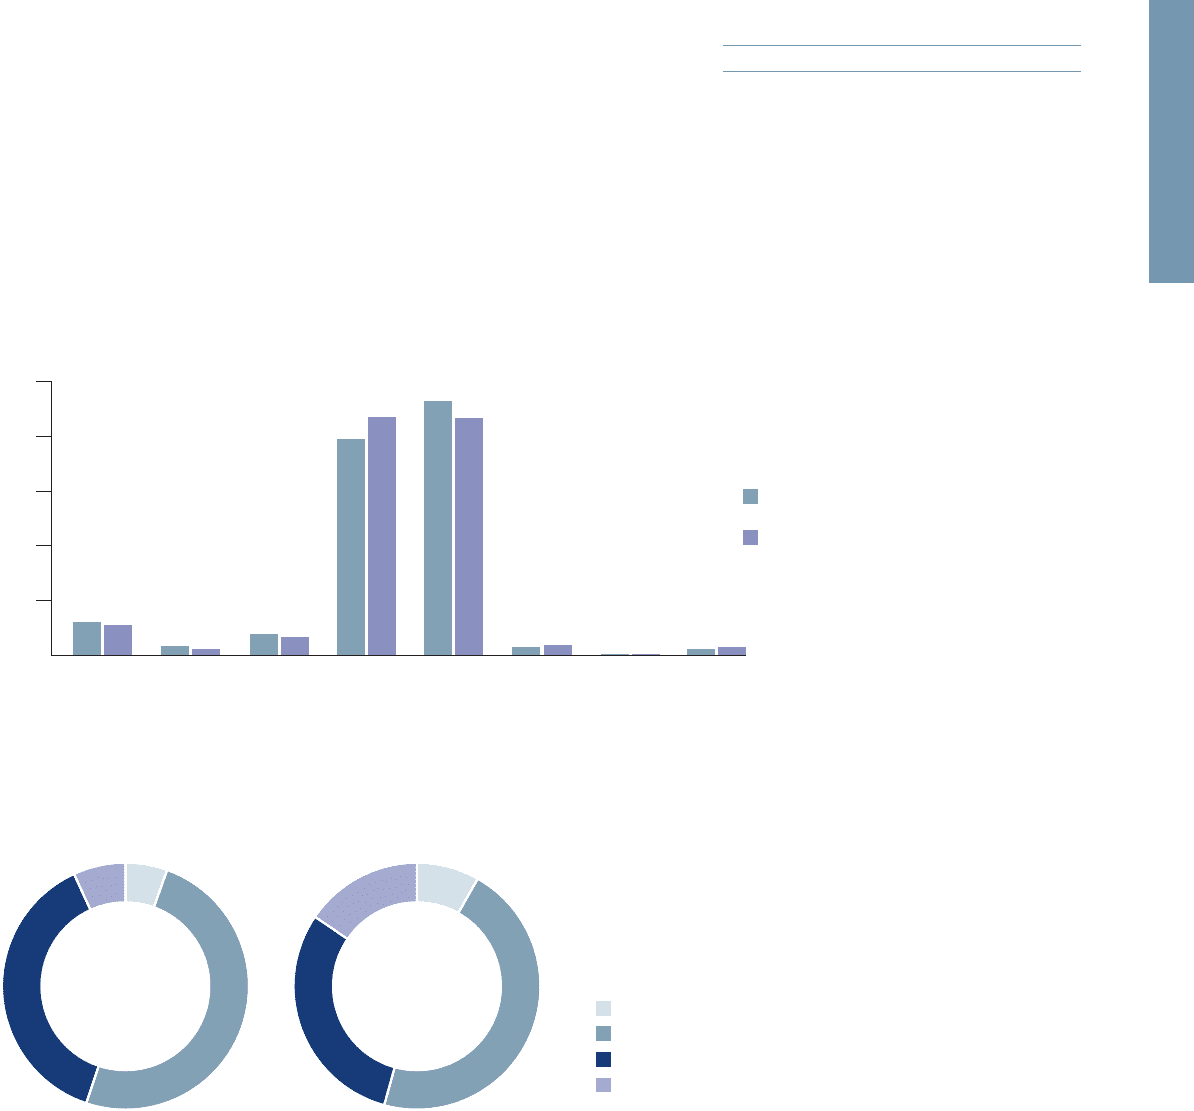
Operational risk events (greater than £10,000) by event category - % of
total events by count.
The chart below shows as at 31 December 2010, execution, delivery and
process management, together with external fraud, continued to account
for circa 90% of losses by count during 2010.
201RBS Group 2010
Business review
Risk and balance sheet management
10%
20%
30%
40%
50%
Clients,
product and
business
practices
% of 2009 loss
events (counts)
% of 2010 loss
events (counts)
Disasters
and
public
safety
Employment
practices and
workplace
safety
Execution,
delivery and
process
management
External
fraud
Internal
fraud
Malicious
damage
Technology
and
infrastructure
failures
Clients, products and business practices
Execution, delivery, and process management
External fraud
Other
2010 2009
The charts below show a similar distribution of losses by value across the risk categories, captured at the date the event occurred and updated as
losses crystallise.
Note:
(1) Work continued throughout 2010 to ensure the treatment, capture and recording of losses in RBS N.V. mirrored the RBS group approach. This has resulted in a small movement in the 2009 metrics
recorded in this report compared to those recorded last year.
Ahigh proportion of the Group’s operational risk events have a low
financial cost associated with them and a very small proportion of
operational risk events have a material impact. In 2010, 96% of reported
operational losses had a value of £100,000 or less (2009 - 95%), but
accounted for 33% of the overall impact (2009 - 18%). In contrast, 0.3%
of the operational risk events had a value of £1 million or greater (2009 -
1%), but accounted for 35% of the overall impact (2009 - 61%).
Fraud prevention
Fraud remains a big challenge to the Group, and the rest of the financial
services industry. The Group continues to respond to this threat,
continually investing in people and processes for both detective and
preventative measures, especially in relation to the impact of organised
crime against the Group. The Group's key strategic programmes continue
to focus on solutions for payment fraud, ATM security, identification of
counterfeit documentation and online banking protection for the Group’s
customers. The Group’s investments have resulted in multi-million pound
savings and, through close working ties with law enforcement agencies,
handing down of significant custodial sentences.