RBS 2010 Annual Report Download - page 158
Download and view the complete annual report
Please find page 158 of the 2010 RBS annual report below. You can navigate through the pages in the report by either clicking on the pages listed below, or by using the keyword search tool below to find specific information within the annual report.-
 1
1 -
2
-
3
-
4
-
5
-
6
-
7
-
8
-
9
-
10
-
11
-
12
-
13
-
14
-
15
-
16
-
17
-
18
-
19
-
20
-
21
-
22
-
23
-
24
-
25
-
26
-
27
-
28
-
29
-
30
-
31
-
32
-
33
-
34
-
35
-
36
-
37
-
38
-
39
-
40
-
41
-
42
-
43
-
44
-
45
-
46
-
47
-
48
-
49
-
50
-
51
-
52
-
53
-
54
-
55
-
56
-
57
-
58
-
59
-
60
-
61
-
62
-
63
-
64
-
65
-
66
-
67
-
68
-
69
-
70
-
71
-
72
-
73
-
74
-
75
-
76
-
77
-
78
-
79
-
80
-
81
-
82
-
83
-
84
-
85
-
86
-
87
-
88
-
89
-
90
-
91
-
92
-
93
-
94
-
95
-
96
-
97
-
98
-
99
-
100
-
101
-
102
-
103
-
104
-
105
-
106
-
107
-
108
-
109
-
110
-
111
-
112
-
113
-
114
-
115
-
116
-
117
-
118
-
119
-
120
-
121
-
122
-
123
-
124
-
125
-
126
-
127
-
128
-
129
-
130
-
131
-
132
-
133
-
134
-
135
-
136
-
137
-
138
-
139
-
140
-
141
-
142
-
143
-
144
-
145
-
146
-
147
-
 148
148 -
 149
149 -
 150
150 -
 151
151 -
 152
152 -
 153
153 -
 154
154 -
 155
155 -
 156
156 -
 157
157 -
 158
158 -
 159
159 -
 160
160 -
 161
161 -
 162
162 -
 163
163 -
 164
164 -
 165
165 -
 166
166 -
 167
167 -
 168
168 -
169
-
170
-
171
-
172
-
173
-
174
-
175
-
176
-
177
-
178
-
179
-
180
-
181
-
182
-
183
-
184
-
185
-
186
-
187
-
188
-
189
-
190
-
191
-
192
-
193
-
194
-
195
-
196
-
197
-
198
-
199
-
200
-
201
-
202
-
203
-
204
-
205
-
206
-
207
-
208
-
209
-
210
-
211
-
212
-
213
-
214
-
215
-
216
-
217
-
218
-
219
-
220
-
221
-
222
-
223
-
224
-
225
-
226
-
227
-
228
-
229
-
230
-
231
-
232
-
233
-
234
-
235
-
236
-
237
-
238
-
239
-
240
-
241
-
242
-
243
-
244
-
245
-
246
-
247
-
248
-
249
-
250
-
251
-
252
-
253
-
254
-
255
-
256
-
257
-
258
-
259
-
260
-
261
-
262
-
263
-
264
-
265
-
266
-
267
-
268
-
269
-
270
-
271
-
272
-
273
-
274
-
275
-
276
-
277
-
278
-
279
-
280
-
281
-
282
-
283
-
284
-
285
-
286
-
287
-
288
-
289
-
290
-
291
-
292
-
293
-
294
-
295
-
296
-
297
-
298
-
299
-
300
-
301
-
302
-
303
-
304
-
305
-
306
-
307
-
308
-
309
-
310
-
311
-
312
-
313
-
314
-
315
-
316
-
317
-
318
-
319
-
320
-
321
-
322
-
323
-
324
-
325
-
326
-
327
-
328
-
329
-
330
-
331
-
332
-
333
-
334
-
335
-
336
-
337
-
338
-
339
-
340
-
341
-
342
-
343
-
344
-
345
-
346
-
347
-
348
-
349
-
350
-
351
-
352
-
353
-
354
-
355
-
356
-
357
-
358
-
359
-
360
-
361
-
362
-
363
-
364
-
365
-
366
-
367
-
368
-
369
-
370
-
371
-
372
-
373
-
374
-
375
-
376
-
377
-
378
-
379
-
380
-
381
-
382
-
383
-
384
-
385
-
386
-
387
-
388
-
389
-
390
-
391
-
392
-
393
-
394
-
395
-
396
-
397
-
398
-
399
-
400
-
401
-
402
-
403
-
404
-
405
-
406
-
407
-
408
-
409
-
410
-
411
-
412
-
413
-
414
-
415
-
416
-
417
-
418
-
419
-
420
-
421
-
422
-
423
-
424
-
425
-
426
-
427
-
428
-
429
-
430
-
431
-
432
-
433
-
434
-
435
-
436
-
437
-
438
-
439
-
440
-
441
-
442
-
443
-
444
-
445
 |
 |

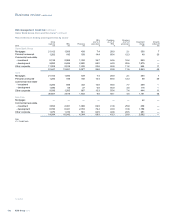
Risk management: Credit risk continued
Credit risk assets* continued
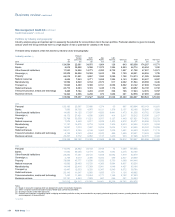
Key credit portfolios
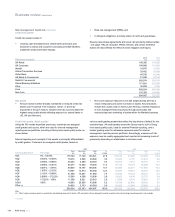
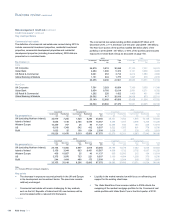
Commercial real estate
The definition of commercial real estate was revised during 2010 to
include commercial investment properties, residential investment
properties, commercial development properties and residential
development properties (including house builders); 2009 data are
presented on a consistent basis.
The commercial real estate lending portfolio totalled £87 billion at 31
December 2010, a 11% decrease over the prior year (2009 - £98 billion).
The Non-Core portion of the portfolio totalled £46 billion (52% of the
portfolio) in 2010 (2009 - £47 billion, or 48% of the portfolio) and includes
exposures in Ulster Bank Group as discussed on page 165.
2010 2009
By division (1) Investment
£m
Development
£m
Total
£m
Investment
£m
Development
£m
Total
£m
Core
UK Corporate 24,879 5,819 30,698 27,143 7,331 34,474
Ulster Bank 4,284 1,090 5,374 6,131 3,838 9,969
US Retail & Commercial 3,061 653 3,714 2,812 1,084 3,896
Global Banking & Markets 1,131 644 1,775 1,997 818 2,815
33,355 8,206 41,561 38,083 13,071 51,154
Non-Core
UK Corporate 7,591 3,263 10,854 7,390 3,959 11,349
Ulster Bank 3,854 8,760 12,614 2,061 6,271 8,332
US Retail & Commercial 1,202 220 1,422 1,409 431 1,840
Global Banking & Markets 20,502 417 20,919 24,638 873 25,511
33,149 12,660 45,809 35,498 11,534 47,032
66,504 20,866 87,370 73,581 24,605 98,186
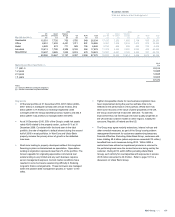
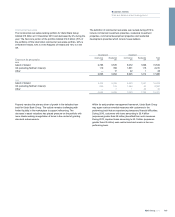
2010 2009
Investment Development Investment Development
By geography (1) Commercial
£m
Residential
£m
Commercial
£m
Residential
£m
Total
£m
Commercial
£m
Residential
£m
Commercial
£m
Residential
£m
Total
£m
UK (excluding Northern Ireland) 32,979 7,255 1,520 8,296 50,050 36,731 7,042 1,875 10,155 55,803
Island of Ireland 5,056 1,148 2,785 6,578 15,567 5,384 1,047 3,484 6,305 16,220
Western Europe 10,359 707 25 46 11,137 12,565 840 184 225 13,814
US 6,010 1,343 542 412 8,307 6,522 1,355 881 778 9,536
RoW 1,622 25 138 524 2,309 2,068 27 239 479 2,813
56,026 10,478 5,010 15,856 87,370 63,270 10,311 6,663 17,942 98,186
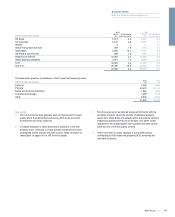
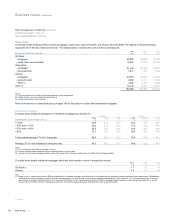
2010 2009
Investment Development Investment Development
By geography (1) Core
£m
Non-Core
£m
Core
£m
Non-Core
£m
Total
£m
Core
£m
Non-Core
£m
Core
£m
Non-Core
£m
Total
£m
UK (excluding Northern Ireland) 26,168 14,066 5,997 3,819 50,050 29,195 14,578 7,482 4,548 55,803
Island of Ireland 3,159 3,044 963 8,401 15,567 4,699 1,732 3,702 6,087 16,220
Western Europe 409 10,657 25 46 11,137 905 12,500 215 194 13,814
US 3,375 3,978 733 221 8,307 3,193 4,684 1,289 370 9,536
RoW 244 1,404 488 173 2,309 91 2,004 383 335 2,813
33,355 33,149 8,206 12,660 87,370 38,083 35,498 13,071 11,534 98,186
Note:
(1) Excludes RRM and contingent obligations.
Key points
xThe decrease in exposure occurred primarily in the UK and Europe
in the development and investment books. The asset mix remains
relatively unchanged.
xCommercial real estate will remain challenging for key markets,
such as the UK, Republic of Ireland and US; new business will be
accommodated within a reduced limit framework.
xLiquidity in the market remains low with focus on refinancing and
support for the existing client base.
xThe Ulster Bank Non-Core increase relative to 2009 reflects the
swapping of the residual mortgage portfolio for the Commercial real
estate portfolio with Ulster Bank Core in the third quarter of 2010.
*unaudited
RBS Group 2010156
Business review continued