RBS 2010 Annual Report Download - page 333
Download and view the complete annual report
Please find page 333 of the 2010 RBS annual report below. You can navigate through the pages in the report by either clicking on the pages listed below, or by using the keyword search tool below to find specific information within the annual report.-
 1
1 -
2
-
3
-
4
-
5
-
6
-
7
-
8
-
9
-
10
-
11
-
12
-
13
-
14
-
15
-
16
-
17
-
18
-
19
-
20
-
21
-
22
-
23
-
24
-
25
-
26
-
27
-
28
-
29
-
30
-
31
-
32
-
33
-
34
-
35
-
36
-
37
-
38
-
39
-
40
-
41
-
42
-
43
-
44
-
45
-
46
-
47
-
48
-
49
-
50
-
51
-
52
-
53
-
54
-
55
-
56
-
57
-
58
-
59
-
60
-
61
-
62
-
63
-
64
-
65
-
66
-
67
-
68
-
69
-
70
-
71
-
72
-
73
-
74
-
75
-
76
-
77
-
78
-
79
-
80
-
81
-
82
-
83
-
84
-
85
-
86
-
87
-
88
-
89
-
90
-
91
-
92
-
93
-
94
-
95
-
96
-
97
-
98
-
99
-
100
-
101
-
102
-
103
-
104
-
105
-
106
-
107
-
108
-
109
-
110
-
111
-
112
-
113
-
114
-
115
-
116
-
117
-
118
-
119
-
120
-
121
-
122
-
123
-
124
-
125
-
126
-
127
-
128
-
129
-
130
-
131
-
132
-
133
-
134
-
135
-
136
-
137
-
138
-
139
-
140
-
141
-
142
-
143
-
144
-
145
-
146
-
147
-
148
-
149
-
150
-
151
-
152
-
153
-
154
-
155
-
156
-
157
-
158
-
159
-
160
-
161
-
162
-
163
-
164
-
165
-
166
-
167
-
168
-
169
-
170
-
171
-
172
-
173
-
174
-
175
-
176
-
177
-
178
-
179
-
180
-
181
-
182
-
183
-
184
-
185
-
186
-
187
-
188
-
189
-
190
-
191
-
192
-
193
-
194
-
195
-
196
-
197
-
198
-
199
-
200
-
201
-
202
-
203
-
204
-
205
-
206
-
207
-
208
-
209
-
210
-
211
-
212
-
213
-
214
-
215
-
216
-
217
-
218
-
219
-
220
-
221
-
222
-
223
-
224
-
225
-
226
-
227
-
228
-
229
-
230
-
231
-
232
-
233
-
234
-
235
-
236
-
237
-
238
-
239
-
240
-
241
-
242
-
243
-
244
-
245
-
246
-
247
-
248
-
249
-
250
-
251
-
252
-
253
-
254
-
255
-
256
-
257
-
258
-
259
-
260
-
261
-
262
-
263
-
264
-
265
-
266
-
267
-
268
-
269
-
270
-
271
-
272
-
273
-
274
-
275
-
276
-
277
-
278
-
279
-
280
-
281
-
282
-
283
-
284
-
285
-
286
-
287
-
288
-
289
-
290
-
291
-
292
-
293
-
294
-
295
-
296
-
297
-
298
-
299
-
300
-
301
-
302
-
303
-
304
-
305
-
306
-
307
-
308
-
309
-
310
-
311
-
312
-
313
-
314
-
315
-
316
-
317
-
318
-
319
-
320
-
321
-
322
-
 323
323 -
 324
324 -
 325
325 -
 326
326 -
 327
327 -
 328
328 -
 329
329 -
 330
330 -
 331
331 -
 332
332 -
 333
333 -
 334
334 -
 335
335 -
 336
336 -
 337
337 -
 338
338 -
 339
339 -
 340
340 -
 341
341 -
 342
342 -
 343
343 -
344
-
345
-
346
-
347
-
348
-
349
-
350
-
351
-
352
-
353
-
354
-
355
-
356
-
357
-
358
-
359
-
360
-
361
-
362
-
363
-
364
-
365
-
366
-
367
-
368
-
369
-
370
-
371
-
372
-
373
-
374
-
375
-
376
-
377
-
378
-
379
-
380
-
381
-
382
-
383
-
384
-
385
-
386
-
387
-
388
-
389
-
390
-
391
-
392
-
393
-
394
-
395
-
396
-
397
-
398
-
399
-
400
-
401
-
402
-
403
-
404
-
405
-
406
-
407
-
408
-
409
-
410
-
411
-
412
-
413
-
414
-
415
-
416
-
417
-
418
-
419
-
420
-
421
-
422
-
423
-
424
-
425
-
426
-
427
-
428
-
429
-
430
-
431
-
432
-
433
-
434
-
435
-
436
-
437
-
438
-
439
-
440
-
441
-
442
-
443
-
444
-
445
 |
 |

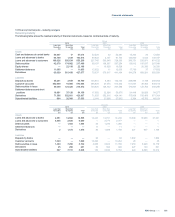
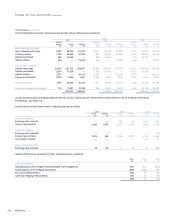
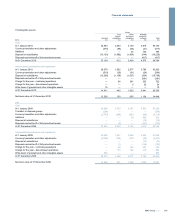
The following tables show, for the Group, when the hedged cash flows are expected to occur and when they will affect income for designated cash flow
hedges.
Group
2010
0-1 years
£m
1-2 years
£m
2-3 years
£m
3-4 years
£m
4-5 years
£m
5-10 years
£m
10-20 years
£m
Over 20 years
£m
Total
£m
Hedged forecast cash flows expected to occur
Forecast receivable cash flows 280 254 219 161 120 169 30 — 1,233
Forecast payable cash flows (47) (41) (33) (30) (30) (137) (176) (54) (548)
Hedged forecast cash flows affect on profit or loss
Forecast receivable cash flows 281 250 214 157 112 161 28 — 1,203
Forecast payable cash flows (46) (41) (33) (30) (29) (137) (175) (54) (545)
2009
Hedged forecast cash flows expected to occur
Forecast receivable cash flows 504 466 423 267 163 379 141 — 2,343
Forecast payable cash flows (554) (521) (416) (350) (299) (990) (819) (167) (4,116)
Hedged forecast cash flows affect on profit or loss
Forecast receivable cash flows 503 467 422 255 163 371 141 — 2,322
Forecast payable cash flows (554) (518) (409) (346) (296) (978) (818) (167) (4,086)
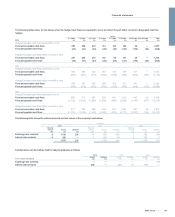
2008
Hedged forecast cash flows expected to occur
Forecast receivable cash flows 985 779 667 554 423 1,323 407 45 5,183
Forecast payable cash flows (1,732) (1,614) (1,390) (1,059) (890) (2,880) (1,397) (257) (11,219)
Hedged forecast cash flows affect on profit or loss
Forecast receivable cash flows 871 758 659 548 421 1,284 397 40 4,978
Forecast payable cash flows (1,701) (1,576) (1,323) (1,023) (878) (2,771) (1,337) (128) (10,737)
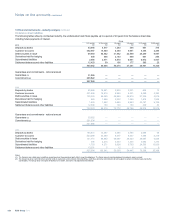
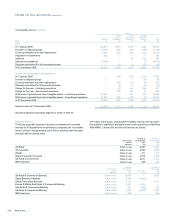
The following table shows the notional amounts and fair values of the company's derivatives.
Company
2010
2009 2008
Notional Notional Notional
amount Assets Liabilities amount Assets Liabilities amount Assets Liabilities
£bn £m £m £bn £m £m £bn £m £m
Exchange rate contracts 61,195 231 10 875 422 7 792 353
Interest rate contracts 4280 — 4 294 24 5 376 8
1,475 231 1,169 446 1,168 361
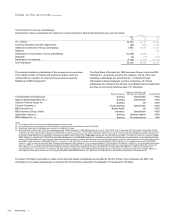
Included above are derivatives held for hedging purposes as follows:
2010 2009 2008
Fair value hedging Assets
£m
Liabilities
£m
Assets
£m
Liabilities
£m
Assets
£m
Liabilities
£m
Exchange rate contracts — — — — — 225
Interest rate contracts 252 — 239 14 193 —
331RBS Group 2010
Financial statements