RBS 2010 Annual Report Download - page 391
Download and view the complete annual report
Please find page 391 of the 2010 RBS annual report below. You can navigate through the pages in the report by either clicking on the pages listed below, or by using the keyword search tool below to find specific information within the annual report.-
 1
1 -
2
-
3
-
4
-
5
-
6
-
7
-
8
-
9
-
10
-
11
-
12
-
13
-
14
-
15
-
16
-
17
-
18
-
19
-
20
-
21
-
22
-
23
-
24
-
25
-
26
-
27
-
28
-
29
-
30
-
31
-
32
-
33
-
34
-
35
-
36
-
37
-
38
-
39
-
40
-
41
-
42
-
43
-
44
-
45
-
46
-
47
-
48
-
49
-
50
-
51
-
52
-
53
-
54
-
55
-
56
-
57
-
58
-
59
-
60
-
61
-
62
-
63
-
64
-
65
-
66
-
67
-
68
-
69
-
70
-
71
-
72
-
73
-
74
-
75
-
76
-
77
-
78
-
79
-
80
-
81
-
82
-
83
-
84
-
85
-
86
-
87
-
88
-
89
-
90
-
91
-
92
-
93
-
94
-
95
-
96
-
97
-
98
-
99
-
100
-
101
-
102
-
103
-
104
-
105
-
106
-
107
-
108
-
109
-
110
-
111
-
112
-
113
-
114
-
115
-
116
-
117
-
118
-
119
-
120
-
121
-
122
-
123
-
124
-
125
-
126
-
127
-
128
-
129
-
130
-
131
-
132
-
133
-
134
-
135
-
136
-
137
-
138
-
139
-
140
-
141
-
142
-
143
-
144
-
145
-
146
-
147
-
148
-
149
-
150
-
151
-
152
-
153
-
154
-
155
-
156
-
157
-
158
-
159
-
160
-
161
-
162
-
163
-
164
-
165
-
166
-
167
-
168
-
169
-
170
-
171
-
172
-
173
-
174
-
175
-
176
-
177
-
178
-
179
-
180
-
181
-
182
-
183
-
184
-
185
-
186
-
187
-
188
-
189
-
190
-
191
-
192
-
193
-
194
-
195
-
196
-
197
-
198
-
199
-
200
-
201
-
202
-
203
-
204
-
205
-
206
-
207
-
208
-
209
-
210
-
211
-
212
-
213
-
214
-
215
-
216
-
217
-
218
-
219
-
220
-
221
-
222
-
223
-
224
-
225
-
226
-
227
-
228
-
229
-
230
-
231
-
232
-
233
-
234
-
235
-
236
-
237
-
238
-
239
-
240
-
241
-
242
-
243
-
244
-
245
-
246
-
247
-
248
-
249
-
250
-
251
-
252
-
253
-
254
-
255
-
256
-
257
-
258
-
259
-
260
-
261
-
262
-
263
-
264
-
265
-
266
-
267
-
268
-
269
-
270
-
271
-
272
-
273
-
274
-
275
-
276
-
277
-
278
-
279
-
280
-
281
-
282
-
283
-
284
-
285
-
286
-
287
-
288
-
289
-
290
-
291
-
292
-
293
-
294
-
295
-
296
-
297
-
298
-
299
-
300
-
301
-
302
-
303
-
304
-
305
-
306
-
307
-
308
-
309
-
310
-
311
-
312
-
313
-
314
-
315
-
316
-
317
-
318
-
319
-
320
-
321
-
322
-
323
-
324
-
325
-
326
-
327
-
328
-
329
-
330
-
331
-
332
-
333
-
334
-
335
-
336
-
337
-
338
-
339
-
340
-
341
-
342
-
343
-
344
-
345
-
346
-
347
-
348
-
349
-
350
-
351
-
352
-
353
-
354
-
355
-
356
-
357
-
358
-
359
-
360
-
361
-
362
-
363
-
364
-
365
-
366
-
367
-
368
-
369
-
370
-
371
-
372
-
373
-
374
-
375
-
376
-
377
-
378
-
379
-
380
-
 381
381 -
 382
382 -
 383
383 -
 384
384 -
 385
385 -
 386
386 -
 387
387 -
 388
388 -
 389
389 -
 390
390 -
 391
391 -
 392
392 -
 393
393 -
 394
394 -
 395
395 -
 396
396 -
 397
397 -
 398
398 -
 399
399 -
 400
400 -
 401
401 -
402
-
403
-
404
-
405
-
406
-
407
-
408
-
409
-
410
-
411
-
412
-
413
-
414
-
415
-
416
-
417
-
418
-
419
-
420
-
421
-
422
-
423
-
424
-
425
-
426
-
427
-
428
-
429
-
430
-
431
-
432
-
433
-
434
-
435
-
436
-
437
-
438
-
439
-
440
-
441
-
442
-
443
-
444
-
445
 |
 |

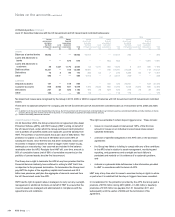
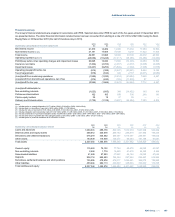
Analysis of loans and advances to customers
The following table analyses loans and advances to customers before provisions by remaining maturity, geographical area and type of customer.
Within
1year
£m
After 1 year
but within
5years
£m
After
5years
£m
2010
Total
£m
2009
£m
2008
£m
2007
£m
2006
£m
UK
Central and local government 2,421 3 1,495 3,919
3,174 3,091 3,135 6,732
Finance 32,902 3,223 2,850 38,975
36,283 42,432 70,006 25,017
Residential mortgages 2,833 3,430 94,894 101,157
92,583 80,967 73,916 70,884
Personal lending 14,747 4,525 3,964 23,236
25,254 26,989 28,186 27,922
Property 14,447 15,306 12,204 41,957 48,895 52,127 50,051 39,296
Construction 4,164 1,111 1,065 6,340 7,780 10,171 10,202 8,251
Manufacturing 5,717 2,059 1,335 9,111
11,432 15,074 13,452 11,051
Service industries and business activities 20,017 10,199 15,469 45,685 51,855 58,638 53,965 43,887
Agriculture, forestry and fishing 1,098 363 1,297 2,758
2,913 2,972 2,473 2,767
Finance leases and instalment credit 3,010 5,736 4,628 13,374
16,186 17,363 15,632 14,218
Accrued interest 500 9 49 558
992 2,463 2,344 1,497
Total domestic 101,856 45,964 139,250 287,070
297,347 312,287 323,362 251,522
Overseas residents 38,234 33,489 16,027 87,750 89,891 119,656 98,845 69,242
Total UK offices 140,090 79,453 155,277 374,820
387,238 431,943 422,207 320,764
Overseas
US 34,754 28,778 27,221 90,753 93,569 126,277 135,059 92,166
Rest of the World 42,837 31,362 33,543 107,742
264,712 327,391 277,721 57,896
Total Overseas offices 77,591 60,140 60,764 198,495
358,281 453,668 412,780 150,062
Loans and advances to customers - gross 217,681 139,593 216,041 573,315 745,519 885,611 834,987 470,826
Loan impairment provisions (18,055) (17,126) (10,889) (6,449) (3,933)
Loans and advances to customers - net 555,260 728,393 874,722 828,538 466,893
Fixed rate 37,074 25,756 47,534 110,364
238,756 183,693 351,336 115,240
Variable rate 180,607 113,837 168,507 462,951 506,763 701,918 483,651 355,586
Loans and advances to customers - gross 217,681 139,593 216,041 573,315 745,519 885,611 834,987 470,826
389RBS Group 2010
Additional information