RBS 2010 Annual Report Download - page 392
Download and view the complete annual report
Please find page 392 of the 2010 RBS annual report below. You can navigate through the pages in the report by either clicking on the pages listed below, or by using the keyword search tool below to find specific information within the annual report.-
 1
1 -
2
-
3
-
4
-
5
-
6
-
7
-
8
-
9
-
10
-
11
-
12
-
13
-
14
-
15
-
16
-
17
-
18
-
19
-
20
-
21
-
22
-
23
-
24
-
25
-
26
-
27
-
28
-
29
-
30
-
31
-
32
-
33
-
34
-
35
-
36
-
37
-
38
-
39
-
40
-
41
-
42
-
43
-
44
-
45
-
46
-
47
-
48
-
49
-
50
-
51
-
52
-
53
-
54
-
55
-
56
-
57
-
58
-
59
-
60
-
61
-
62
-
63
-
64
-
65
-
66
-
67
-
68
-
69
-
70
-
71
-
72
-
73
-
74
-
75
-
76
-
77
-
78
-
79
-
80
-
81
-
82
-
83
-
84
-
85
-
86
-
87
-
88
-
89
-
90
-
91
-
92
-
93
-
94
-
95
-
96
-
97
-
98
-
99
-
100
-
101
-
102
-
103
-
104
-
105
-
106
-
107
-
108
-
109
-
110
-
111
-
112
-
113
-
114
-
115
-
116
-
117
-
118
-
119
-
120
-
121
-
122
-
123
-
124
-
125
-
126
-
127
-
128
-
129
-
130
-
131
-
132
-
133
-
134
-
135
-
136
-
137
-
138
-
139
-
140
-
141
-
142
-
143
-
144
-
145
-
146
-
147
-
148
-
149
-
150
-
151
-
152
-
153
-
154
-
155
-
156
-
157
-
158
-
159
-
160
-
161
-
162
-
163
-
164
-
165
-
166
-
167
-
168
-
169
-
170
-
171
-
172
-
173
-
174
-
175
-
176
-
177
-
178
-
179
-
180
-
181
-
182
-
183
-
184
-
185
-
186
-
187
-
188
-
189
-
190
-
191
-
192
-
193
-
194
-
195
-
196
-
197
-
198
-
199
-
200
-
201
-
202
-
203
-
204
-
205
-
206
-
207
-
208
-
209
-
210
-
211
-
212
-
213
-
214
-
215
-
216
-
217
-
218
-
219
-
220
-
221
-
222
-
223
-
224
-
225
-
226
-
227
-
228
-
229
-
230
-
231
-
232
-
233
-
234
-
235
-
236
-
237
-
238
-
239
-
240
-
241
-
242
-
243
-
244
-
245
-
246
-
247
-
248
-
249
-
250
-
251
-
252
-
253
-
254
-
255
-
256
-
257
-
258
-
259
-
260
-
261
-
262
-
263
-
264
-
265
-
266
-
267
-
268
-
269
-
270
-
271
-
272
-
273
-
274
-
275
-
276
-
277
-
278
-
279
-
280
-
281
-
282
-
283
-
284
-
285
-
286
-
287
-
288
-
289
-
290
-
291
-
292
-
293
-
294
-
295
-
296
-
297
-
298
-
299
-
300
-
301
-
302
-
303
-
304
-
305
-
306
-
307
-
308
-
309
-
310
-
311
-
312
-
313
-
314
-
315
-
316
-
317
-
318
-
319
-
320
-
321
-
322
-
323
-
324
-
325
-
326
-
327
-
328
-
329
-
330
-
331
-
332
-
333
-
334
-
335
-
336
-
337
-
338
-
339
-
340
-
341
-
342
-
343
-
344
-
345
-
346
-
347
-
348
-
349
-
350
-
351
-
352
-
353
-
354
-
355
-
356
-
357
-
358
-
359
-
360
-
361
-
362
-
363
-
364
-
365
-
366
-
367
-
368
-
369
-
370
-
371
-
372
-
373
-
374
-
375
-
376
-
377
-
378
-
379
-
380
-
381
-
 382
382 -
 383
383 -
 384
384 -
 385
385 -
 386
386 -
 387
387 -
 388
388 -
 389
389 -
 390
390 -
 391
391 -
 392
392 -
 393
393 -
 394
394 -
 395
395 -
 396
396 -
 397
397 -
 398
398 -
 399
399 -
 400
400 -
 401
401 -
 402
402 -
403
-
404
-
405
-
406
-
407
-
408
-
409
-
410
-
411
-
412
-
413
-
414
-
415
-
416
-
417
-
418
-
419
-
420
-
421
-
422
-
423
-
424
-
425
-
426
-
427
-
428
-
429
-
430
-
431
-
432
-
433
-
434
-
435
-
436
-
437
-
438
-
439
-
440
-
441
-
442
-
443
-
444
-
445
 |
 |

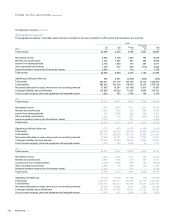
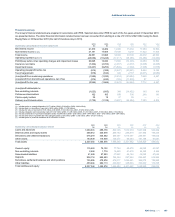
Financial summary continued
Loan impairment provisions
For a discussion of the factors considered in determining the amount of provisions, see ‘Risk elements in lending, provisions and reserves’ on page 181
and ‘Critical accounting policies’ on page 283. The following table shows the movements in loan impairment provisions.
2010
£m
2009
£m
2008
£m
2007
£m
2006
£m
Provisions at the beginning of the year
Domestic 6,670 4,474 3,258 3,037 2,759
Foreign 10,613 6,542 3,194 898 1,128
17,283 11,016 6,452 3,935 3,887
Transfer to disposal groups
Domestic (25) — — — —
Foreign (47) (324) (767) — —
(72) (324) (767) — —
Currency translation and other adjustments
Domestic (79) (228) 107 5 (17)
Foreign 122 (302) 1,334 178 (44)
43 (530) 1,441 183 (61)
(Disposals)/acquisitions of businesses
Domestic ——(108) 10 —
Foreign (2,172) (65) (70) 2,211 —
(2,172) (65) (178) 2,221 —
Amounts written-off
Domestic (2,252) (2,895) (1,446) (1,222) (1,360)
Foreign (3,790) (4,044) (1,702) (789) (481)
(6,042) (6,939) (3,148) (2,011) (1,841)
Recoveries of amounts written-off in previous years
Domestic 151 175 116 158 119
Foreign 260 224 203 184 96
411 399 319 342 215
Charged to income statement -continuing operations (1)
Domestic 3,948 5,370 2,701 1,395 1,663
Foreign 5,196 7,720 3,777 508 214
9,144 13,090 6,478 1,903 1,877
Charged to income statement - discontinued operations
Domestic ——(3) 25 —
Foreign 42 1,044 616 18 —
42 1,044 613 43 —
Unwind of discount
Domestic (214) (226) (151) (150) (127)
Foreign (241) (182) (43) (14) (15)
(455) (408) (194) (164) (142)
Provisions at the end of the year (2)
Domestic 8,199 6,670 4,474 3,258 3,037
Foreign 9,983 10,613 6,542 3,194 898
18,182 17,283 11,016 6,452 3,935
Gross loans and advances to customers
Domestic 287,070 297,347 312,287 323,362 251,522
Foreign 286,245 448,172 573,324 511,625 219,304
573,315 745,519 885,611 834,987 470,826
Closing customer provisions as a % of gross loans and advances to customers (3)
Domestic 2.86% 2.24% 1.43% 1.01% 1.21%
Foreign 3.44% 2.33% 1.12% 0.62% 0.41%
Total 3.15% 2.30% 1.23% 0.77% 0.84%
Customer charge to income statement as a % of gross loans and advances to customers (3)
Domestic 1.38% 1.81% 0.86% 0.44% 0.66%
Foreign 1.82% 1.95% 0.75% 0.10% 0.10%
Total 1.60% 1.89% 0.79% 0.23% 0.40%
Notes:
(1) Includes release relating to loans and advances to banks of £13 million (2009 - £34 million charge; 2008 - £118 million charge; 2007 and 2006 - nil).
(2) Includes closing provisions against loans and advances to banks of £127 million (2009 - £157 million; 2008 - £127 million; 2007 - £3 million; 2006 - £2 million).
(3) For the purpose of these ratios, closing customer provisions and customer charge exclude loans and advances to banks.
RBS Group 2010390
Additional information continued