RBS 2010 Annual Report Download - page 92
Download and view the complete annual report
Please find page 92 of the 2010 RBS annual report below. You can navigate through the pages in the report by either clicking on the pages listed below, or by using the keyword search tool below to find specific information within the annual report.-
 1
1 -
2
-
3
-
4
-
5
-
6
-
7
-
8
-
9
-
10
-
11
-
12
-
13
-
14
-
15
-
16
-
17
-
18
-
19
-
20
-
21
-
22
-
23
-
24
-
25
-
26
-
27
-
28
-
29
-
30
-
31
-
32
-
33
-
34
-
35
-
36
-
37
-
38
-
39
-
40
-
41
-
42
-
43
-
44
-
45
-
46
-
47
-
48
-
49
-
50
-
51
-
52
-
53
-
54
-
55
-
56
-
57
-
58
-
59
-
60
-
61
-
62
-
63
-
64
-
65
-
66
-
67
-
68
-
69
-
70
-
71
-
72
-
73
-
74
-
75
-
76
-
77
-
78
-
79
-
80
-
81
-
 82
82 -
 83
83 -
 84
84 -
 85
85 -
 86
86 -
 87
87 -
 88
88 -
 89
89 -
 90
90 -
 91
91 -
 92
92 -
 93
93 -
 94
94 -
 95
95 -
 96
96 -
 97
97 -
 98
98 -
 99
99 -
 100
100 -
 101
101 -
 102
102 -
103
-
104
-
105
-
106
-
107
-
108
-
109
-
110
-
111
-
112
-
113
-
114
-
115
-
116
-
117
-
118
-
119
-
120
-
121
-
122
-
123
-
124
-
125
-
126
-
127
-
128
-
129
-
130
-
131
-
132
-
133
-
134
-
135
-
136
-
137
-
138
-
139
-
140
-
141
-
142
-
143
-
144
-
145
-
146
-
147
-
148
-
149
-
150
-
151
-
152
-
153
-
154
-
155
-
156
-
157
-
158
-
159
-
160
-
161
-
162
-
163
-
164
-
165
-
166
-
167
-
168
-
169
-
170
-
171
-
172
-
173
-
174
-
175
-
176
-
177
-
178
-
179
-
180
-
181
-
182
-
183
-
184
-
185
-
186
-
187
-
188
-
189
-
190
-
191
-
192
-
193
-
194
-
195
-
196
-
197
-
198
-
199
-
200
-
201
-
202
-
203
-
204
-
205
-
206
-
207
-
208
-
209
-
210
-
211
-
212
-
213
-
214
-
215
-
216
-
217
-
218
-
219
-
220
-
221
-
222
-
223
-
224
-
225
-
226
-
227
-
228
-
229
-
230
-
231
-
232
-
233
-
234
-
235
-
236
-
237
-
238
-
239
-
240
-
241
-
242
-
243
-
244
-
245
-
246
-
247
-
248
-
249
-
250
-
251
-
252
-
253
-
254
-
255
-
256
-
257
-
258
-
259
-
260
-
261
-
262
-
263
-
264
-
265
-
266
-
267
-
268
-
269
-
270
-
271
-
272
-
273
-
274
-
275
-
276
-
277
-
278
-
279
-
280
-
281
-
282
-
283
-
284
-
285
-
286
-
287
-
288
-
289
-
290
-
291
-
292
-
293
-
294
-
295
-
296
-
297
-
298
-
299
-
300
-
301
-
302
-
303
-
304
-
305
-
306
-
307
-
308
-
309
-
310
-
311
-
312
-
313
-
314
-
315
-
316
-
317
-
318
-
319
-
320
-
321
-
322
-
323
-
324
-
325
-
326
-
327
-
328
-
329
-
330
-
331
-
332
-
333
-
334
-
335
-
336
-
337
-
338
-
339
-
340
-
341
-
342
-
343
-
344
-
345
-
346
-
347
-
348
-
349
-
350
-
351
-
352
-
353
-
354
-
355
-
356
-
357
-
358
-
359
-
360
-
361
-
362
-
363
-
364
-
365
-
366
-
367
-
368
-
369
-
370
-
371
-
372
-
373
-
374
-
375
-
376
-
377
-
378
-
379
-
380
-
381
-
382
-
383
-
384
-
385
-
386
-
387
-
388
-
389
-
390
-
391
-
392
-
393
-
394
-
395
-
396
-
397
-
398
-
399
-
400
-
401
-
402
-
403
-
404
-
405
-
406
-
407
-
408
-
409
-
410
-
411
-
412
-
413
-
414
-
415
-
416
-
417
-
418
-
419
-
420
-
421
-
422
-
423
-
424
-
425
-
426
-
427
-
428
-
429
-
430
-
431
-
432
-
433
-
434
-
435
-
436
-
437
-
438
-
439
-
440
-
441
-
442
-
443
-
444
-
445
 |
 |

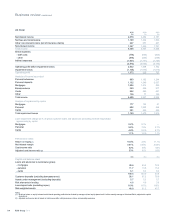
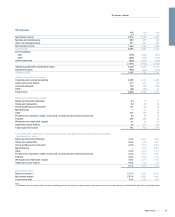
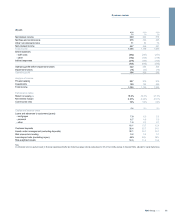
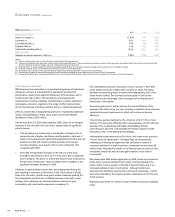
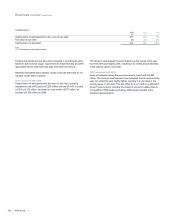
Ulster Bank continued
2010 2009 2008
£bn £bn £bn
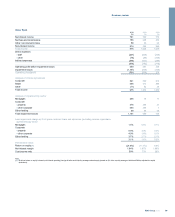
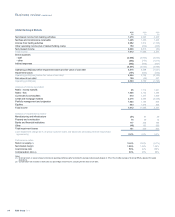
Capital and balance sheet
Loans and advances to customers (gross)
- mortgages 21.2 16.2 18.1
- corporate
- property 5.4 10.1 10.9
- other corporate 9.0 11.0 12.9
- other lending 1.3 2.4 2.1
36.9 39.7 44.0
Customer deposits 23.1 21.9 24.3
Risk elements in lending
- mortgages 1.5 0.6 0.3
- corporate
- property 0.7 0.7 0.5
- other corporate 1.2 0.8 0.3
- other lending 0.2 0.2 0.1
3.6 2.3 1.2
Loan:deposit ratio (excluding repos) 152% 177% 179%
Risk-weighted assets 31.6 29.9 24.5
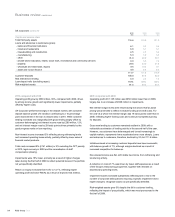
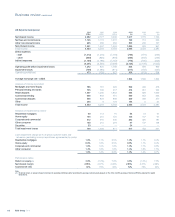
2010 compared with 2009
Overall performance deteriorated in 2010, largely as a result of an
increase in impairment losses of £512 million. Operating profit before
impairment increased to £400 million, up 50% in constant currency terms,
driven by the culmination of a bank-wide cost saving programme during
2010.
Net interest income increased by 1% on a constant currency basis as
actions to increase asset margins were largely eroded by tightening
deposit margins due to intensive market competition.
Non-interest income was 14% lower on a constant currency basis
reflecting a non-recurring gain in 2009.
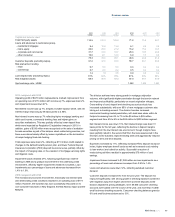
Loans to customers fell by 5% in constant currency terms. On 1 July
2010 the division transferred a portfolio of development property assets
to the Non-Core division, partially offset by a simultaneous transfer of a
portfolio of retail mortgage assets to the core business.
Despite intense competition, customer deposit balances increased by 8%
in constant currency terms over the year with strong growth across all
deposit categories, driven by a focus on improving the bank’s funding
profile.
Expenses at constant exchange rates were 22% lower. The strong year-
on-year performance in expenses was primarily driven by an increased
focus on active management of the cost base, and the benefits derived
from the business restructuring and cost-saving programme which
commenced in 2009.
Impairment losses increased by £512 million to £1,161 million reflecting
the deteriorating economic environment in Ireland and rising default
levels across both personal and corporate portfolios. Lower asset values,
particularly in property-related lending together with pressure on
borrowers with a dependence on consumer spending have resulted in
higher corporate loan losses, while higher unemployment, lower incomes
and increased taxation have driven mortgage impairment increases.
Risk-weighted assets have increased due to deteriorating credit risk
metrics.
Customer numbers increased by 3% during 2010, with a strong
performance in current and savings accounts switchers.
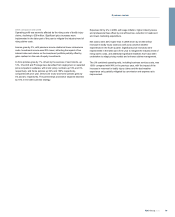
2009 compared with 2008
Operating results were in line with expectations but deteriorated during
2009 as economic conditions across the island of Ireland worsened, with
an operating loss for the year of £368 million.
Net interest income declined by 7% in constant currency terms, largely as
aresult of tightening deposit margins in an increasingly competitive
market, partly offset by asset repricing initiatives. Net interest margin for
the year at 1.87% remained broadly stable despite the challenging
market conditions.
At constant exchange rates loans to customers decreased by 4% from
the prior year as new business demand weakened. Customer deposits
reduced by 5% in 2009 in constant currency terms, reflecting an
increasingly competitive Irish deposit market and reductions in wholesale
funding during Q1. During the second half of the year the market
stabilised and the division recorded strong growth in customer balances
resulting in an improved funding profile.
RBS Group 201090
Business review continued