RBS 2010 Annual Report Download - page 172
Download and view the complete annual report
Please find page 172 of the 2010 RBS annual report below. You can navigate through the pages in the report by either clicking on the pages listed below, or by using the keyword search tool below to find specific information within the annual report.-
 1
1 -
2
-
3
-
4
-
5
-
6
-
7
-
8
-
9
-
10
-
11
-
12
-
13
-
14
-
15
-
16
-
17
-
18
-
19
-
20
-
21
-
22
-
23
-
24
-
25
-
26
-
27
-
28
-
29
-
30
-
31
-
32
-
33
-
34
-
35
-
36
-
37
-
38
-
39
-
40
-
41
-
42
-
43
-
44
-
45
-
46
-
47
-
48
-
49
-
50
-
51
-
52
-
53
-
54
-
55
-
56
-
57
-
58
-
59
-
60
-
61
-
62
-
63
-
64
-
65
-
66
-
67
-
68
-
69
-
70
-
71
-
72
-
73
-
74
-
75
-
76
-
77
-
78
-
79
-
80
-
81
-
82
-
83
-
84
-
85
-
86
-
87
-
88
-
89
-
90
-
91
-
92
-
93
-
94
-
95
-
96
-
97
-
98
-
99
-
100
-
101
-
102
-
103
-
104
-
105
-
106
-
107
-
108
-
109
-
110
-
111
-
112
-
113
-
114
-
115
-
116
-
117
-
118
-
119
-
120
-
121
-
122
-
123
-
124
-
125
-
126
-
127
-
128
-
129
-
130
-
131
-
132
-
133
-
134
-
135
-
136
-
137
-
138
-
139
-
140
-
141
-
142
-
143
-
144
-
145
-
146
-
147
-
148
-
149
-
150
-
151
-
152
-
153
-
154
-
155
-
156
-
157
-
158
-
159
-
160
-
161
-
 162
162 -
 163
163 -
 164
164 -
 165
165 -
 166
166 -
 167
167 -
 168
168 -
 169
169 -
 170
170 -
 171
171 -
 172
172 -
 173
173 -
 174
174 -
 175
175 -
 176
176 -
 177
177 -
 178
178 -
 179
179 -
 180
180 -
 181
181 -
 182
182 -
183
-
184
-
185
-
186
-
187
-
188
-
189
-
190
-
191
-
192
-
193
-
194
-
195
-
196
-
197
-
198
-
199
-
200
-
201
-
202
-
203
-
204
-
205
-
206
-
207
-
208
-
209
-
210
-
211
-
212
-
213
-
214
-
215
-
216
-
217
-
218
-
219
-
220
-
221
-
222
-
223
-
224
-
225
-
226
-
227
-
228
-
229
-
230
-
231
-
232
-
233
-
234
-
235
-
236
-
237
-
238
-
239
-
240
-
241
-
242
-
243
-
244
-
245
-
246
-
247
-
248
-
249
-
250
-
251
-
252
-
253
-
254
-
255
-
256
-
257
-
258
-
259
-
260
-
261
-
262
-
263
-
264
-
265
-
266
-
267
-
268
-
269
-
270
-
271
-
272
-
273
-
274
-
275
-
276
-
277
-
278
-
279
-
280
-
281
-
282
-
283
-
284
-
285
-
286
-
287
-
288
-
289
-
290
-
291
-
292
-
293
-
294
-
295
-
296
-
297
-
298
-
299
-
300
-
301
-
302
-
303
-
304
-
305
-
306
-
307
-
308
-
309
-
310
-
311
-
312
-
313
-
314
-
315
-
316
-
317
-
318
-
319
-
320
-
321
-
322
-
323
-
324
-
325
-
326
-
327
-
328
-
329
-
330
-
331
-
332
-
333
-
334
-
335
-
336
-
337
-
338
-
339
-
340
-
341
-
342
-
343
-
344
-
345
-
346
-
347
-
348
-
349
-
350
-
351
-
352
-
353
-
354
-
355
-
356
-
357
-
358
-
359
-
360
-
361
-
362
-
363
-
364
-
365
-
366
-
367
-
368
-
369
-
370
-
371
-
372
-
373
-
374
-
375
-
376
-
377
-
378
-
379
-
380
-
381
-
382
-
383
-
384
-
385
-
386
-
387
-
388
-
389
-
390
-
391
-
392
-
393
-
394
-
395
-
396
-
397
-
398
-
399
-
400
-
401
-
402
-
403
-
404
-
405
-
406
-
407
-
408
-
409
-
410
-
411
-
412
-
413
-
414
-
415
-
416
-
417
-
418
-
419
-
420
-
421
-
422
-
423
-
424
-
425
-
426
-
427
-
428
-
429
-
430
-
431
-
432
-
433
-
434
-
435
-
436
-
437
-
438
-
439
-
440
-
441
-
442
-
443
-
444
-
445
 |
 |

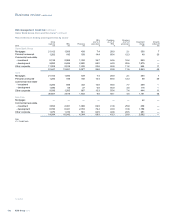
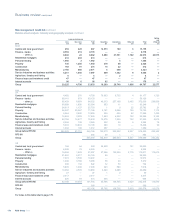
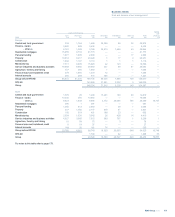
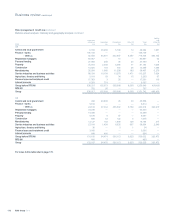
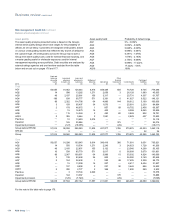
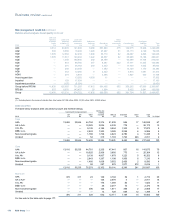
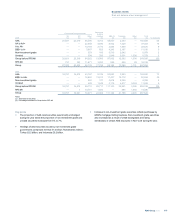
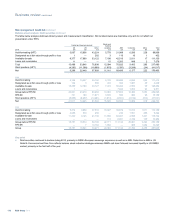
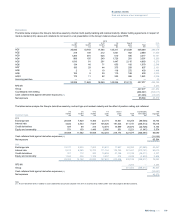
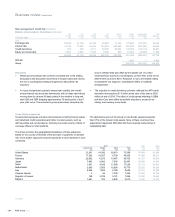
Risk management: Credit risk continued
Balance sheet analysis: Industry and geography analysis continued
Loans and advances
Core Non-Core Total Securities Derivatives Other (1) Total
Netting
and
offset (2)
2010 £m £m £m £m £m £m £m £m
RoW
Central and local government 459 428 887 14,073 189 6 15,155 —
Finance - banks 9,559 219 9,778 — — — 9,778 —
- other (3) 8,840 22 8,862 3,888 27,531 1,792 42,073 22,575
Residential mortgages 410 203 613 — — — 613 —
Personal lending 1,460 2 1,462 — 6 — 1,468 —
Property 735 1,205 1,940 318 68 — 2,326 —
Construction 183 91 274 16 22 — 312 —
Manufacturing 2,185 686 2,871 4 448 — 3,323 —
Service industries and business activities 5,251 1,846 7,097 899 1,482 8 9,486 2
Agriculture, forestry and fishing 6 — 6 — 2 — 8 —
Finance lease and instalment credit 47 — 47 — — — 47 —
Interest accruals 90 6 96 82 — — 178 —
Group 29,225 4,708 33,933 19,280 29,748 1,806 84,767 22,577
2009
UK
Central and local government 4,482 276 4,758 79,663 6,752 4 91,177 1,725
Finance - banks 58,141 979 59,120 — — — 59,120 —
- other (3) 56,429 8,093 64,522 45,513 257,109 5,492 372,636 238,926
Residential mortgages 90,688 1,896 92,584 653 11 — 93,248 7
Personal lending 24,613 1,137 25,750 1 9 22 25,782 21
Property 36,407 35,387 71,794 3,761 4,086 104 79,745 1,114
Construction 6,964 3,640 10,604 354 849 62 11,869 1,450
Manufacturing 14,644 3,255 17,899 1,643 4,222 102 23,866 3,184
Service industries and business activities 62,756 15,877 78,633 10,279 7,849 742 97,503 5,810
Agriculture, forestry and fishing 2,946 138 3,084 252 39 9 3,384 76
Finance lease and instalment credit 5,343 10,843 16,186 294 16 — 16,496 39
Interest accruals 1,032 180 1,212 457 — — 1,669 —
Group before RFS MI 364,445 81,701 446,146 142,870 280,942 6,537 876,495 252,352
RFS MI 444 49 1 — 494 —
Group 446,590 142,919 280,943 6,537 876,989 252,352
US
Central and local government 196 64 260 24,620 9 141 25,030 —
Finance - banks 8,448 76 8,524 — — — 8,524 —
- other (3) 19,404 1,803 21,207 27,086 125,599 5,779 179,671 113,670
Residential mortgages 21,842 4,317 26,159 64 — — 26,223 —
Personal lending 7,373 3,599 10,972 — — — 10,972 —
Property 1,498 3,788 5,286 56 30 — 5,372 —
Construction 490 132 622 72 50 — 744 —
Manufacturing 5,895 1,200 7,095 243 580 — 7,918 —
Service industries and business activities 14,358 4,505 18,863 3,320 2,486 — 24,669 —
Agriculture, forestry and fishing 27 — 27 1 2 — 30 —
Finance lease and instalment credit 2,417 — 2,417 — — — 2,417 —
Interest accruals 220 94 314 334 — — 648 —
Group before RFS MI 82,168 19,578 101,746 55,796 128,756 5,920 292,218 113,670
RFS MI 360 — — — 360 —
Group 102,106 55,796 128,756 5,920 292,578 113,670
For notes to this table refer to page 173.
RBS Group 2010170
Business review continued