RBS 2010 Annual Report Download - page 330
Download and view the complete annual report
Please find page 330 of the 2010 RBS annual report below. You can navigate through the pages in the report by either clicking on the pages listed below, or by using the keyword search tool below to find specific information within the annual report.-
 1
1 -
2
-
3
-
4
-
5
-
6
-
7
-
8
-
9
-
10
-
11
-
12
-
13
-
14
-
15
-
16
-
17
-
18
-
19
-
20
-
21
-
22
-
23
-
24
-
25
-
26
-
27
-
28
-
29
-
30
-
31
-
32
-
33
-
34
-
35
-
36
-
37
-
38
-
39
-
40
-
41
-
42
-
43
-
44
-
45
-
46
-
47
-
48
-
49
-
50
-
51
-
52
-
53
-
54
-
55
-
56
-
57
-
58
-
59
-
60
-
61
-
62
-
63
-
64
-
65
-
66
-
67
-
68
-
69
-
70
-
71
-
72
-
73
-
74
-
75
-
76
-
77
-
78
-
79
-
80
-
81
-
82
-
83
-
84
-
85
-
86
-
87
-
88
-
89
-
90
-
91
-
92
-
93
-
94
-
95
-
96
-
97
-
98
-
99
-
100
-
101
-
102
-
103
-
104
-
105
-
106
-
107
-
108
-
109
-
110
-
111
-
112
-
113
-
114
-
115
-
116
-
117
-
118
-
119
-
120
-
121
-
122
-
123
-
124
-
125
-
126
-
127
-
128
-
129
-
130
-
131
-
132
-
133
-
134
-
135
-
136
-
137
-
138
-
139
-
140
-
141
-
142
-
143
-
144
-
145
-
146
-
147
-
148
-
149
-
150
-
151
-
152
-
153
-
154
-
155
-
156
-
157
-
158
-
159
-
160
-
161
-
162
-
163
-
164
-
165
-
166
-
167
-
168
-
169
-
170
-
171
-
172
-
173
-
174
-
175
-
176
-
177
-
178
-
179
-
180
-
181
-
182
-
183
-
184
-
185
-
186
-
187
-
188
-
189
-
190
-
191
-
192
-
193
-
194
-
195
-
196
-
197
-
198
-
199
-
200
-
201
-
202
-
203
-
204
-
205
-
206
-
207
-
208
-
209
-
210
-
211
-
212
-
213
-
214
-
215
-
216
-
217
-
218
-
219
-
220
-
221
-
222
-
223
-
224
-
225
-
226
-
227
-
228
-
229
-
230
-
231
-
232
-
233
-
234
-
235
-
236
-
237
-
238
-
239
-
240
-
241
-
242
-
243
-
244
-
245
-
246
-
247
-
248
-
249
-
250
-
251
-
252
-
253
-
254
-
255
-
256
-
257
-
258
-
259
-
260
-
261
-
262
-
263
-
264
-
265
-
266
-
267
-
268
-
269
-
270
-
271
-
272
-
273
-
274
-
275
-
276
-
277
-
278
-
279
-
280
-
281
-
282
-
283
-
284
-
285
-
286
-
287
-
288
-
289
-
290
-
291
-
292
-
293
-
294
-
295
-
296
-
297
-
298
-
299
-
300
-
301
-
302
-
303
-
304
-
305
-
306
-
307
-
308
-
309
-
310
-
311
-
312
-
313
-
314
-
315
-
316
-
317
-
318
-
319
-
 320
320 -
 321
321 -
 322
322 -
 323
323 -
 324
324 -
 325
325 -
 326
326 -
 327
327 -
 328
328 -
 329
329 -
 330
330 -
 331
331 -
 332
332 -
 333
333 -
 334
334 -
 335
335 -
 336
336 -
 337
337 -
 338
338 -
 339
339 -
 340
340 -
341
-
342
-
343
-
344
-
345
-
346
-
347
-
348
-
349
-
350
-
351
-
352
-
353
-
354
-
355
-
356
-
357
-
358
-
359
-
360
-
361
-
362
-
363
-
364
-
365
-
366
-
367
-
368
-
369
-
370
-
371
-
372
-
373
-
374
-
375
-
376
-
377
-
378
-
379
-
380
-
381
-
382
-
383
-
384
-
385
-
386
-
387
-
388
-
389
-
390
-
391
-
392
-
393
-
394
-
395
-
396
-
397
-
398
-
399
-
400
-
401
-
402
-
403
-
404
-
405
-
406
-
407
-
408
-
409
-
410
-
411
-
412
-
413
-
414
-
415
-
416
-
417
-
418
-
419
-
420
-
421
-
422
-
423
-
424
-
425
-
426
-
427
-
428
-
429
-
430
-
431
-
432
-
433
-
434
-
435
-
436
-
437
-
438
-
439
-
440
-
441
-
442
-
443
-
444
-
445
 |
 |

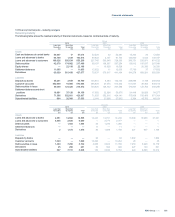
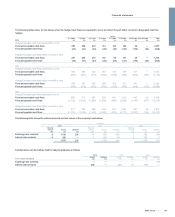
14 Financial assets - impairments
The following table shows the movement in the provision for impairment losses on loans and advances.
Group
Individually
assessed
Collectively
assessed Latent
Total
2010 2009 2008
£m £m £m £m £m £m
At 1 January 8,953 5,254 3,076 17,283
11,016 6,452
Transfer to disposal groups (72) — — (72) (324) (767)
Currency translation and other adjustments (15) 27 31 43
(530) 1,441
Disposal of subsidiaries (1,344) (526) (302) (2,172) (65) (178)
Amounts written-off (3,323) (2,719) — (6,042) (6,939) (3,148)
Recoveries of amounts previously written-off 90 321 — 411
399 319
Charged/(credited) to the income statement – continuing operations 6,195 3,070 (121) 9,144
13,090 6,478
Charged/(credited) to the income statement – discontinued operations 35 41 (34) 42
1,044 613
Unwind of discount (283) (172) — (455) (408) (194)
At 31 December (1) 10,236 5,296 2,650 18,182
17,283 11,016
Notes:
(1) Includes £127 million relating to loans and advances to banks (2009 - £157 million; 2008 - £127 million).
(2) There is no provision for impairment losses in the company.
Group
Impairment losses charged to the income statement 2010
£m
2009
£m
2008
£m
Loans and advances to customers 9,157 13,056 6,360
Loans and advances to banks (13) 34 118
9,144 13,090 6,478
Debt securities 81 601 858
Equity shares 31 208 103
112 809 961
9,256 13,899 7,439
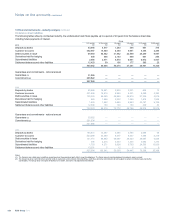
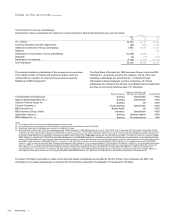
The following tables show an analysis of impaired financial assets.
Group
2010
2009 2008
Carrying Carrying Carrying
Cost Provision value Cost Provision value Cost Provision value
£m £m £m £m £m £m £m £m £m
Loans and receivables
Loans and advances to banks (1) 145 127 18 206 157 49 129 127 2
Loans and advances to customers (2) 35,556 15,405 20,151 34,801 14,050 20,751 19,350 8,945 10,405
35,701 15,532 20,169 35,007 14,207 20,800 19,479 9,072 10,407
Notes:
(1) Impairment provisions individually assessed.
(2) Impairment provisions individually assessed on balances of £25,492 million (2009 - £24,540 million; 2008 - £11,313 million).
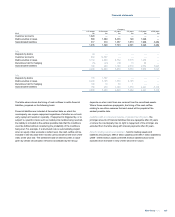
Group
Carrying Carrying Carrying
Value Value Value
2010 2009 2008
£m £m £m
Available-for-sale securities
Debt securities 580 758 618
Equity shares 43 180 87
Loans and receivables
Debt securities 230 ——
853 938 705
RBS Group 2010328
Notes on the accounts continued