RBS 2010 Annual Report Download - page 107
Download and view the complete annual report
Please find page 107 of the 2010 RBS annual report below. You can navigate through the pages in the report by either clicking on the pages listed below, or by using the keyword search tool below to find specific information within the annual report.-
 1
1 -
2
-
3
-
4
-
5
-
6
-
7
-
8
-
9
-
10
-
11
-
12
-
13
-
14
-
15
-
16
-
17
-
18
-
19
-
20
-
21
-
22
-
23
-
24
-
25
-
26
-
27
-
28
-
29
-
30
-
31
-
32
-
33
-
34
-
35
-
36
-
37
-
38
-
39
-
40
-
41
-
42
-
43
-
44
-
45
-
46
-
47
-
48
-
49
-
50
-
51
-
52
-
53
-
54
-
55
-
56
-
57
-
58
-
59
-
60
-
61
-
62
-
63
-
64
-
65
-
66
-
67
-
68
-
69
-
70
-
71
-
72
-
73
-
74
-
75
-
76
-
77
-
78
-
79
-
80
-
81
-
82
-
83
-
84
-
85
-
86
-
87
-
88
-
89
-
90
-
91
-
92
-
93
-
94
-
95
-
96
-
 97
97 -
 98
98 -
 99
99 -
 100
100 -
 101
101 -
 102
102 -
 103
103 -
 104
104 -
 105
105 -
 106
106 -
 107
107 -
 108
108 -
 109
109 -
 110
110 -
 111
111 -
 112
112 -
 113
113 -
 114
114 -
 115
115 -
 116
116 -
 117
117 -
118
-
119
-
120
-
121
-
122
-
123
-
124
-
125
-
126
-
127
-
128
-
129
-
130
-
131
-
132
-
133
-
134
-
135
-
136
-
137
-
138
-
139
-
140
-
141
-
142
-
143
-
144
-
145
-
146
-
147
-
148
-
149
-
150
-
151
-
152
-
153
-
154
-
155
-
156
-
157
-
158
-
159
-
160
-
161
-
162
-
163
-
164
-
165
-
166
-
167
-
168
-
169
-
170
-
171
-
172
-
173
-
174
-
175
-
176
-
177
-
178
-
179
-
180
-
181
-
182
-
183
-
184
-
185
-
186
-
187
-
188
-
189
-
190
-
191
-
192
-
193
-
194
-
195
-
196
-
197
-
198
-
199
-
200
-
201
-
202
-
203
-
204
-
205
-
206
-
207
-
208
-
209
-
210
-
211
-
212
-
213
-
214
-
215
-
216
-
217
-
218
-
219
-
220
-
221
-
222
-
223
-
224
-
225
-
226
-
227
-
228
-
229
-
230
-
231
-
232
-
233
-
234
-
235
-
236
-
237
-
238
-
239
-
240
-
241
-
242
-
243
-
244
-
245
-
246
-
247
-
248
-
249
-
250
-
251
-
252
-
253
-
254
-
255
-
256
-
257
-
258
-
259
-
260
-
261
-
262
-
263
-
264
-
265
-
266
-
267
-
268
-
269
-
270
-
271
-
272
-
273
-
274
-
275
-
276
-
277
-
278
-
279
-
280
-
281
-
282
-
283
-
284
-
285
-
286
-
287
-
288
-
289
-
290
-
291
-
292
-
293
-
294
-
295
-
296
-
297
-
298
-
299
-
300
-
301
-
302
-
303
-
304
-
305
-
306
-
307
-
308
-
309
-
310
-
311
-
312
-
313
-
314
-
315
-
316
-
317
-
318
-
319
-
320
-
321
-
322
-
323
-
324
-
325
-
326
-
327
-
328
-
329
-
330
-
331
-
332
-
333
-
334
-
335
-
336
-
337
-
338
-
339
-
340
-
341
-
342
-
343
-
344
-
345
-
346
-
347
-
348
-
349
-
350
-
351
-
352
-
353
-
354
-
355
-
356
-
357
-
358
-
359
-
360
-
361
-
362
-
363
-
364
-
365
-
366
-
367
-
368
-
369
-
370
-
371
-
372
-
373
-
374
-
375
-
376
-
377
-
378
-
379
-
380
-
381
-
382
-
383
-
384
-
385
-
386
-
387
-
388
-
389
-
390
-
391
-
392
-
393
-
394
-
395
-
396
-
397
-
398
-
399
-
400
-
401
-
402
-
403
-
404
-
405
-
406
-
407
-
408
-
409
-
410
-
411
-
412
-
413
-
414
-
415
-
416
-
417
-
418
-
419
-
420
-
421
-
422
-
423
-
424
-
425
-
426
-
427
-
428
-
429
-
430
-
431
-
432
-
433
-
434
-
435
-
436
-
437
-
438
-
439
-
440
-
441
-
442
-
443
-
444
-
445
 |
 |

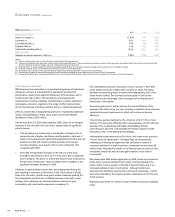
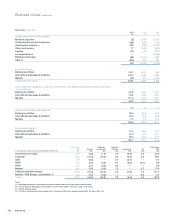
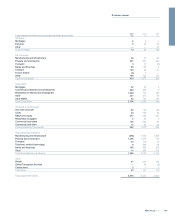
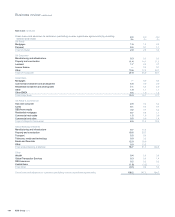
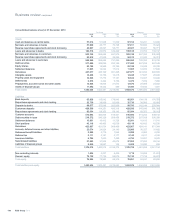
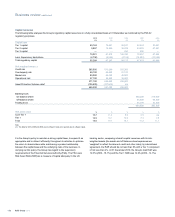
2010 compared with 2009
By the end of 2010 third party assets (excluding derivatives) had
decreased to £138 billion, £5 billion lower than the end of year target, as
aresult of a successful disposal strategy, managed portfolio run-off and
impairments.
2010 operating losses in Non-Core were 62% lower than those recorded
in 2009. The improvement in performance was driven by significantly
lower trading losses, reduced expenses and a marked decline in
impairments.
Losses from trading activities declined from £5,161 million for 2009 to
£31 million for 2010 as underlying asset prices recovered, offset by
continuing weakness in credit spreads. The division has recorded profits
on the disposal of many asset-backed securities positions. In addition, a
significantly smaller loss of £161 million was recorded on banking book
hedges as spreads tightened, compared with £1,728 million in 2009.
Staff expenses fell by 14% over the year, largely driven by the impact of
business divestments, including a number of country exits and the
disposal of substantially all of the Group’s interest in the RBS Sempra
Commodities JV.
Impairments were £3,745 million lower than 2009. The decline reflects
the overall improvement in the economic environment, although still high
loss rates reflect the difficult conditions experienced in specific sectors,
including both UK and Irish commercial property sectors.
Wholesale country exits completed during 2010 were Chile, Colombia,
Pakistan and Taiwan.
Risk-weighted assets decreased by £18 billion (10%), reflecting active
management to reduce trading book risk and disposals, partially offset by
the impact of regulatory changes (£30 billion) and more conservative
weightings applied to large corporate exposures.
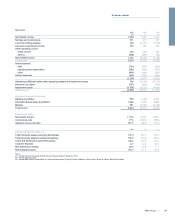
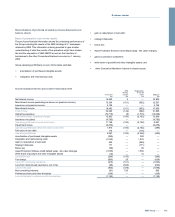
2009 compared with 2008
Losses from trading activities have declined significantly as underlying
asset prices rallied. Mark-to-market values for exposures such as
monolines, super senior high grade collateralised debt obligations, and
many negative basis trade asset classes have risen over the course of
2009. However, the £1.6 billion gain recorded on banking book hedging
in 2008 unwound over the course of the year to a loss of £1.6 billion in
2009, as spreads continued to tighten throughout the year, ending almost
in line with origination levels.
Impairment losses increased to £9.2 billion, reflecting continued
weakness in the economic environment, particularly across the corporate
and property sectors. There were signs of a slowdown in the rate of
provisioning towards the end of the year.
Staff costs decreased by 14% over the year, or by 20% at constant
exchange rates, due to headcount reductions and business divestments,
notably Linea Directa and Tesco Personal Finance. Lower depreciation
charges followed the 2008 sale of the Angel Trains business.
Third party assets, excluding derivatives, decreased by £56.9 billion in
the year as the division has run down exposures and pursued
opportunities to dispose of loan portfolios. Sales of equity stakes,
including Bank of China, were concluded while further disposals
announced in 2009, including Asian retail and commercial operations, are
moving towards completion in 2010.
Risk-weighted assets increased by 0.2% in 2009, and at constant
exchange rates increased by 3%. The reduction of 15% since 30
September 2009, reflects active management to reduce trading book
exposures, largely offset by the impact of procyclicality, monoline
downgrades and adverse market risk.
105RBS Group 2010
Business review