RBS 2010 Annual Report Download - page 64
Download and view the complete annual report
Please find page 64 of the 2010 RBS annual report below. You can navigate through the pages in the report by either clicking on the pages listed below, or by using the keyword search tool below to find specific information within the annual report.-
 1
1 -
2
-
3
-
4
-
5
-
6
-
7
-
8
-
9
-
10
-
11
-
12
-
13
-
14
-
15
-
16
-
17
-
18
-
19
-
20
-
21
-
22
-
23
-
24
-
25
-
26
-
27
-
28
-
29
-
30
-
31
-
32
-
33
-
34
-
35
-
36
-
37
-
38
-
39
-
40
-
41
-
42
-
43
-
44
-
45
-
46
-
47
-
48
-
49
-
50
-
51
-
52
-
53
-
 54
54 -
 55
55 -
 56
56 -
 57
57 -
 58
58 -
 59
59 -
 60
60 -
 61
61 -
 62
62 -
 63
63 -
 64
64 -
 65
65 -
 66
66 -
 67
67 -
 68
68 -
 69
69 -
 70
70 -
 71
71 -
 72
72 -
 73
73 -
 74
74 -
75
-
76
-
77
-
78
-
79
-
80
-
81
-
82
-
83
-
84
-
85
-
86
-
87
-
88
-
89
-
90
-
91
-
92
-
93
-
94
-
95
-
96
-
97
-
98
-
99
-
100
-
101
-
102
-
103
-
104
-
105
-
106
-
107
-
108
-
109
-
110
-
111
-
112
-
113
-
114
-
115
-
116
-
117
-
118
-
119
-
120
-
121
-
122
-
123
-
124
-
125
-
126
-
127
-
128
-
129
-
130
-
131
-
132
-
133
-
134
-
135
-
136
-
137
-
138
-
139
-
140
-
141
-
142
-
143
-
144
-
145
-
146
-
147
-
148
-
149
-
150
-
151
-
152
-
153
-
154
-
155
-
156
-
157
-
158
-
159
-
160
-
161
-
162
-
163
-
164
-
165
-
166
-
167
-
168
-
169
-
170
-
171
-
172
-
173
-
174
-
175
-
176
-
177
-
178
-
179
-
180
-
181
-
182
-
183
-
184
-
185
-
186
-
187
-
188
-
189
-
190
-
191
-
192
-
193
-
194
-
195
-
196
-
197
-
198
-
199
-
200
-
201
-
202
-
203
-
204
-
205
-
206
-
207
-
208
-
209
-
210
-
211
-
212
-
213
-
214
-
215
-
216
-
217
-
218
-
219
-
220
-
221
-
222
-
223
-
224
-
225
-
226
-
227
-
228
-
229
-
230
-
231
-
232
-
233
-
234
-
235
-
236
-
237
-
238
-
239
-
240
-
241
-
242
-
243
-
244
-
245
-
246
-
247
-
248
-
249
-
250
-
251
-
252
-
253
-
254
-
255
-
256
-
257
-
258
-
259
-
260
-
261
-
262
-
263
-
264
-
265
-
266
-
267
-
268
-
269
-
270
-
271
-
272
-
273
-
274
-
275
-
276
-
277
-
278
-
279
-
280
-
281
-
282
-
283
-
284
-
285
-
286
-
287
-
288
-
289
-
290
-
291
-
292
-
293
-
294
-
295
-
296
-
297
-
298
-
299
-
300
-
301
-
302
-
303
-
304
-
305
-
306
-
307
-
308
-
309
-
310
-
311
-
312
-
313
-
314
-
315
-
316
-
317
-
318
-
319
-
320
-
321
-
322
-
323
-
324
-
325
-
326
-
327
-
328
-
329
-
330
-
331
-
332
-
333
-
334
-
335
-
336
-
337
-
338
-
339
-
340
-
341
-
342
-
343
-
344
-
345
-
346
-
347
-
348
-
349
-
350
-
351
-
352
-
353
-
354
-
355
-
356
-
357
-
358
-
359
-
360
-
361
-
362
-
363
-
364
-
365
-
366
-
367
-
368
-
369
-
370
-
371
-
372
-
373
-
374
-
375
-
376
-
377
-
378
-
379
-
380
-
381
-
382
-
383
-
384
-
385
-
386
-
387
-
388
-
389
-
390
-
391
-
392
-
393
-
394
-
395
-
396
-
397
-
398
-
399
-
400
-
401
-
402
-
403
-
404
-
405
-
406
-
407
-
408
-
409
-
410
-
411
-
412
-
413
-
414
-
415
-
416
-
417
-
418
-
419
-
420
-
421
-
422
-
423
-
424
-
425
-
426
-
427
-
428
-
429
-
430
-
431
-
432
-
433
-
434
-
435
-
436
-
437
-
438
-
439
-
440
-
441
-
442
-
443
-
444
-
445
 |
 |

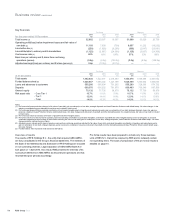
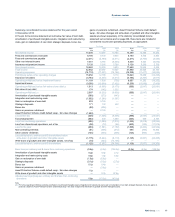
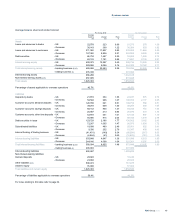
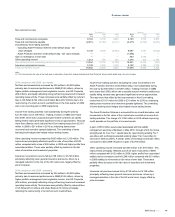
Analysis of results
Net interest income
Pro forma Statutory
2010 2009 2008
2010 2009 2008
£m £m £m
£m £m £m
Interest receivable (1,2,6) 22,693 26,390 42,197 22,703 26,377 42,606
Interest payable (1,2,7) (8,855) (13,107) (26,877) (8,856) (13,273) (27,568)
Net interest income 13,838 13,283 15,320 13,847 13,104 15,038
%% % %% %
Gross yield on interest-earning assets of the banking business (3) 3.29 3.50 5.72
3.29 3.51 5.63
Cost of interest-bearing liabilities of the banking business (1.48) (1.95) (3.88) (1.48) (1.96) (3.84)
Interest spread of the banking business (4) 1.81 1.55 1.84
1.81 1.55 1.79
Benefit from interest-free funds 0.20 0.21 0.24
0.19 0.19 0.20
Net interest margin of the banking business (5) 2.01 1.76 2.08
2.00 1.74 1.99
Yields, spreads and margins of the banking business %% % %% %
Gross yield (3)
- Group 3.29 3.50 5.72 3.29 3.51 5.63
- UK 3.40 3.33 5.77 3.40 3.33 5.72
- Overseas 3.14 3.71 5.66 3.13 3.71 5.55
Interest spread (4)
- Group 1.81 1.55 1.84 1.81 1.55 1.79
- UK 2.04 1.48 1.88 2.04 1.48 1.94
- Overseas 1.50 1.66 1.79 1.49 1.62 1.64
Net interest margin (5)
- Group 2.01 1.76 2.08 2.00 1.74 1.99
- UK 2.19 1.74 2.28 2.19 1.73 2.34
- Overseas 1.76 1.80 1.86 1.75 1.75 1.64
The Royal Bank of Scotland plc base rate (average) 0.50 0.64 4.67 0.50 0.64 4.67
London inter-bank three month offered rates (average)
- Sterling 0.70 1.21 5.51 0.70 1.21 5.51
- Eurodollar 0.34 0.69 2.92 0.34 0.69 2.92
- Euro 0.75 1.21 4.63 0.75 1.21 4.63
Notes:
(1) Interest-earning assets and interest-bearing liabilities exclude the Retail bancassurance long-term assets and liabilities attributable to policyholders, in view of their distinct nature. As a result, net
interest receivable has been increased by £6 million (2009 - £20 million; 2008 - £84 million).
(2) Interest receivable has been increased by £11 million (2009 - £46 million; 2008 - £332 million) and interest payable has been decreased by £30 million (2009 - £350 million increase; 2008 - £860
million increase) to record interest on financial assets and liabilities designated as at fair value through profit or loss. Related interest-earning assets and interest-bearing liabilities have also been
adjusted.
(3) Gross yield is the interest rate earned on average interest-earning assets of the banking business.
(4) Interest spread is the difference between the gross yield and the interest rate paid on average interest-bearing liabilities of the banking business.
(5) Net interest margin is net interest income of the banking business as a percentage of average interest-earning assets of the banking business.
(6) Interest receivable has been decreased by £90 million in respect of a non-recurring receivable (2009 - nil; 2008 - nil).
(7) Interest payable has been increased by £319 million in respect of non-recurring adjustments (2009 - nil; 2008 - nil).
RBS Group 201062
Business review continued