RBS 2010 Annual Report Download - page 171
Download and view the complete annual report
Please find page 171 of the 2010 RBS annual report below. You can navigate through the pages in the report by either clicking on the pages listed below, or by using the keyword search tool below to find specific information within the annual report.-
 1
1 -
2
-
3
-
4
-
5
-
6
-
7
-
8
-
9
-
10
-
11
-
12
-
13
-
14
-
15
-
16
-
17
-
18
-
19
-
20
-
21
-
22
-
23
-
24
-
25
-
26
-
27
-
28
-
29
-
30
-
31
-
32
-
33
-
34
-
35
-
36
-
37
-
38
-
39
-
40
-
41
-
42
-
43
-
44
-
45
-
46
-
47
-
48
-
49
-
50
-
51
-
52
-
53
-
54
-
55
-
56
-
57
-
58
-
59
-
60
-
61
-
62
-
63
-
64
-
65
-
66
-
67
-
68
-
69
-
70
-
71
-
72
-
73
-
74
-
75
-
76
-
77
-
78
-
79
-
80
-
81
-
82
-
83
-
84
-
85
-
86
-
87
-
88
-
89
-
90
-
91
-
92
-
93
-
94
-
95
-
96
-
97
-
98
-
99
-
100
-
101
-
102
-
103
-
104
-
105
-
106
-
107
-
108
-
109
-
110
-
111
-
112
-
113
-
114
-
115
-
116
-
117
-
118
-
119
-
120
-
121
-
122
-
123
-
124
-
125
-
126
-
127
-
128
-
129
-
130
-
131
-
132
-
133
-
134
-
135
-
136
-
137
-
138
-
139
-
140
-
141
-
142
-
143
-
144
-
145
-
146
-
147
-
148
-
149
-
150
-
151
-
152
-
153
-
154
-
155
-
156
-
157
-
158
-
159
-
160
-
 161
161 -
 162
162 -
 163
163 -
 164
164 -
 165
165 -
 166
166 -
 167
167 -
 168
168 -
 169
169 -
 170
170 -
 171
171 -
 172
172 -
 173
173 -
 174
174 -
 175
175 -
 176
176 -
 177
177 -
 178
178 -
 179
179 -
 180
180 -
 181
181 -
182
-
183
-
184
-
185
-
186
-
187
-
188
-
189
-
190
-
191
-
192
-
193
-
194
-
195
-
196
-
197
-
198
-
199
-
200
-
201
-
202
-
203
-
204
-
205
-
206
-
207
-
208
-
209
-
210
-
211
-
212
-
213
-
214
-
215
-
216
-
217
-
218
-
219
-
220
-
221
-
222
-
223
-
224
-
225
-
226
-
227
-
228
-
229
-
230
-
231
-
232
-
233
-
234
-
235
-
236
-
237
-
238
-
239
-
240
-
241
-
242
-
243
-
244
-
245
-
246
-
247
-
248
-
249
-
250
-
251
-
252
-
253
-
254
-
255
-
256
-
257
-
258
-
259
-
260
-
261
-
262
-
263
-
264
-
265
-
266
-
267
-
268
-
269
-
270
-
271
-
272
-
273
-
274
-
275
-
276
-
277
-
278
-
279
-
280
-
281
-
282
-
283
-
284
-
285
-
286
-
287
-
288
-
289
-
290
-
291
-
292
-
293
-
294
-
295
-
296
-
297
-
298
-
299
-
300
-
301
-
302
-
303
-
304
-
305
-
306
-
307
-
308
-
309
-
310
-
311
-
312
-
313
-
314
-
315
-
316
-
317
-
318
-
319
-
320
-
321
-
322
-
323
-
324
-
325
-
326
-
327
-
328
-
329
-
330
-
331
-
332
-
333
-
334
-
335
-
336
-
337
-
338
-
339
-
340
-
341
-
342
-
343
-
344
-
345
-
346
-
347
-
348
-
349
-
350
-
351
-
352
-
353
-
354
-
355
-
356
-
357
-
358
-
359
-
360
-
361
-
362
-
363
-
364
-
365
-
366
-
367
-
368
-
369
-
370
-
371
-
372
-
373
-
374
-
375
-
376
-
377
-
378
-
379
-
380
-
381
-
382
-
383
-
384
-
385
-
386
-
387
-
388
-
389
-
390
-
391
-
392
-
393
-
394
-
395
-
396
-
397
-
398
-
399
-
400
-
401
-
402
-
403
-
404
-
405
-
406
-
407
-
408
-
409
-
410
-
411
-
412
-
413
-
414
-
415
-
416
-
417
-
418
-
419
-
420
-
421
-
422
-
423
-
424
-
425
-
426
-
427
-
428
-
429
-
430
-
431
-
432
-
433
-
434
-
435
-
436
-
437
-
438
-
439
-
440
-
441
-
442
-
443
-
444
-
445
 |
 |

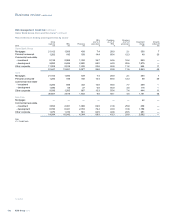
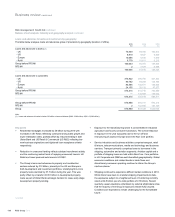
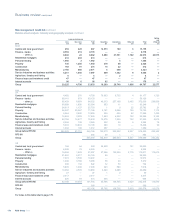
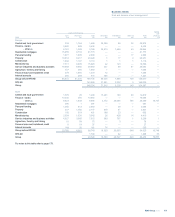
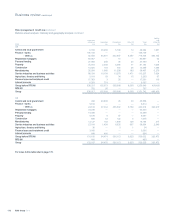
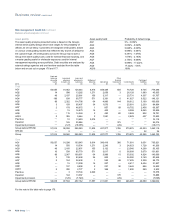
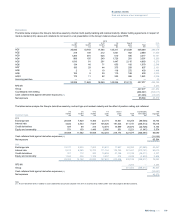
The tables below and on pages 169 to 173 analyse financial assets by geography (location of office) and industry.
Loans and advances
Core Non-Core Total Securities Derivatives Other (1) Total
Netting
and
offset (2)
2010 £m £m £m £m £m £m £m £m
UK
Central and local government 6,339 173 6,512 72,428 7,300 173 86,413 3,916
Finance - banks 69,911 481 70,392 — — — 70,392 —
- other (3) 61,180 6,024 67,204 51,015 249,324 5,390 372,933 256,949
Residential mortgages 99,928 1,665 101,593 748 6 — 102,347 14
Personal lending 23,035 585 23,620 1 9 23 23,653 11
Property 34,970 30,492 65,462 2,477 3,739 28 71,706 1,041
Construction 7,041 2,310 9,351 39 741 — 10,131 1,392
Manufacturing 12,689 1,510 14,199 354 2,159 — 16,712 2,150
Service industries and business activities 58,265 11,742 70,007 2,993 7,940 337 81,277 6,306
Agriculture, forestry and fishing 2,872 67 2,939 — 35 — 2,974 94
Finance lease and instalment credit 5,589 7,785 13,374 15 14 — 13,403 134
Interest accruals 471 98 569 501 — — 1,070 —
Group 382,290 62,932 445,222 130,571 271,267 5,951 853,011 272,007
US
Central and local government 263 53 316 25,741 5 112 26,174 —
Finance - banks 9,798 12 9,810 — — — 9,810 —
- other (3) 25,306 826 26,132 23,975 121,717 4,950 176,774 123,862
Residential mortgages 20,548 3,653 24,201 60 — — 24,261 —
Personal lending 6,816 2,704 9,520 — — — 9,520 —
Property 1,611 3,318 4,929 99 23 — 5,051 —
Construction 442 78 520 5 16 — 541 —
Manufacturing 5,459 143 5,602 434 583 — 6,619 —
Service industries and business activities 14,198 2,725 16,923 3,285 2,764 42 23,014 —
Agriculture, forestry and fishing 31 — 31 28 3 — 62 —
Finance lease and instalment credit 2,315 — 2,315 — — — 2,315 —
Interest accruals 190 73 263 240 — — 503 —
Group 86,977 13,585 100,562 53,867 125,111 5,104 284,644 123,862
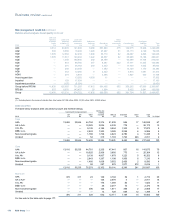
Europe
Central and local government 365 1,017 1,382 18,648 66 — 20,096 —
Finance - banks 10,315 312 10,627 — — — 10,627 —
- other (3) 2,641 1,019 3,660 17,076 746 53 21,535 1
Residential mortgages 19,473 621 20,094 — — — 20,094 —
Personal lending 2,270 600 2,870 62 — 25 2,957 —
Property 5,139 12,636 17,775 43 — — 17,818 —
Construction 1,014 873 1,887 27 1 — 1,915 —
Manufacturing 5,853 4,181 10,034 105 39 — 10,178 6
Service industries and business activities 17,538 6,071 23,609 900 99 1 24,609 92
Agriculture, forestry and fishing 849 68 917 1 — — 918 —
Finance lease and instalment credit 369 745 1,114 — — — 1,114 —
Interest accruals 170 102 272 575 — — 847 —
Group before RFS MI 65,996 28,245 94,241 37,437 951 79 132,708 99
RFS MI 2—— — 2—
Group 94,243 37,437 951 79 132,710 99
For notes to this table refer to page 173.
169RBS Group 2010
Business review
Risk and balance sheet management