RBS 2010 Annual Report Download - page 156
Download and view the complete annual report
Please find page 156 of the 2010 RBS annual report below. You can navigate through the pages in the report by either clicking on the pages listed below, or by using the keyword search tool below to find specific information within the annual report.-
 1
1 -
2
-
3
-
4
-
5
-
6
-
7
-
8
-
9
-
10
-
11
-
12
-
13
-
14
-
15
-
16
-
17
-
18
-
19
-
20
-
21
-
22
-
23
-
24
-
25
-
26
-
27
-
28
-
29
-
30
-
31
-
32
-
33
-
34
-
35
-
36
-
37
-
38
-
39
-
40
-
41
-
42
-
43
-
44
-
45
-
46
-
47
-
48
-
49
-
50
-
51
-
52
-
53
-
54
-
55
-
56
-
57
-
58
-
59
-
60
-
61
-
62
-
63
-
64
-
65
-
66
-
67
-
68
-
69
-
70
-
71
-
72
-
73
-
74
-
75
-
76
-
77
-
78
-
79
-
80
-
81
-
82
-
83
-
84
-
85
-
86
-
87
-
88
-
89
-
90
-
91
-
92
-
93
-
94
-
95
-
96
-
97
-
98
-
99
-
100
-
101
-
102
-
103
-
104
-
105
-
106
-
107
-
108
-
109
-
110
-
111
-
112
-
113
-
114
-
115
-
116
-
117
-
118
-
119
-
120
-
121
-
122
-
123
-
124
-
125
-
126
-
127
-
128
-
129
-
130
-
131
-
132
-
133
-
134
-
135
-
136
-
137
-
138
-
139
-
140
-
141
-
142
-
143
-
144
-
145
-
 146
146 -
 147
147 -
 148
148 -
 149
149 -
 150
150 -
 151
151 -
 152
152 -
 153
153 -
 154
154 -
 155
155 -
 156
156 -
 157
157 -
 158
158 -
 159
159 -
 160
160 -
 161
161 -
 162
162 -
 163
163 -
 164
164 -
 165
165 -
 166
166 -
167
-
168
-
169
-
170
-
171
-
172
-
173
-
174
-
175
-
176
-
177
-
178
-
179
-
180
-
181
-
182
-
183
-
184
-
185
-
186
-
187
-
188
-
189
-
190
-
191
-
192
-
193
-
194
-
195
-
196
-
197
-
198
-
199
-
200
-
201
-
202
-
203
-
204
-
205
-
206
-
207
-
208
-
209
-
210
-
211
-
212
-
213
-
214
-
215
-
216
-
217
-
218
-
219
-
220
-
221
-
222
-
223
-
224
-
225
-
226
-
227
-
228
-
229
-
230
-
231
-
232
-
233
-
234
-
235
-
236
-
237
-
238
-
239
-
240
-
241
-
242
-
243
-
244
-
245
-
246
-
247
-
248
-
249
-
250
-
251
-
252
-
253
-
254
-
255
-
256
-
257
-
258
-
259
-
260
-
261
-
262
-
263
-
264
-
265
-
266
-
267
-
268
-
269
-
270
-
271
-
272
-
273
-
274
-
275
-
276
-
277
-
278
-
279
-
280
-
281
-
282
-
283
-
284
-
285
-
286
-
287
-
288
-
289
-
290
-
291
-
292
-
293
-
294
-
295
-
296
-
297
-
298
-
299
-
300
-
301
-
302
-
303
-
304
-
305
-
306
-
307
-
308
-
309
-
310
-
311
-
312
-
313
-
314
-
315
-
316
-
317
-
318
-
319
-
320
-
321
-
322
-
323
-
324
-
325
-
326
-
327
-
328
-
329
-
330
-
331
-
332
-
333
-
334
-
335
-
336
-
337
-
338
-
339
-
340
-
341
-
342
-
343
-
344
-
345
-
346
-
347
-
348
-
349
-
350
-
351
-
352
-
353
-
354
-
355
-
356
-
357
-
358
-
359
-
360
-
361
-
362
-
363
-
364
-
365
-
366
-
367
-
368
-
369
-
370
-
371
-
372
-
373
-
374
-
375
-
376
-
377
-
378
-
379
-
380
-
381
-
382
-
383
-
384
-
385
-
386
-
387
-
388
-
389
-
390
-
391
-
392
-
393
-
394
-
395
-
396
-
397
-
398
-
399
-
400
-
401
-
402
-
403
-
404
-
405
-
406
-
407
-
408
-
409
-
410
-
411
-
412
-
413
-
414
-
415
-
416
-
417
-
418
-
419
-
420
-
421
-
422
-
423
-
424
-
425
-
426
-
427
-
428
-
429
-
430
-
431
-
432
-
433
-
434
-
435
-
436
-
437
-
438
-
439
-
440
-
441
-
442
-
443
-
444
-
445
 |
 |

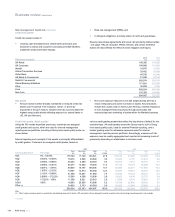
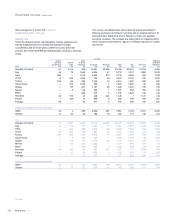
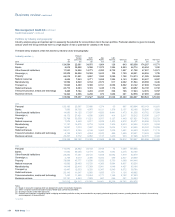
Risk management: Credit risk continued
Credit risk assets* continued
Portfolio by industry and geography
Industryanalysis plays an important part in assessing the potential for concentration risk in the loan portfolio. Particular attention is given to industry
sectors where the Group believes there is a high degree of risk or potential for volatility in the future.
The table below analyses credit risk assets by industry sector and geography.
Industry sector (1)
2010
UK
£m
Western
Europe
(excl. UK)
£m
North
America
£m
Asia
Pacific
£m
Latin
America
£m
Other (2)
£m
Total
£m
Core
£m
Non-Core
£m
Personal 124,594 22,661 34,970 1,864 126 843 185,058 174,287 10,771
Banks 6,819 39,828 5,098 11,072 1,394 2,503 66,714 65,494 1,220
Other financial institutions 17,550 14,986 14,773 4,200 8,732 1,557 61,798 47,227 14,571
Sovereign (3) 20,209 24,826 18,088 3,243 125 1,790 68,281 66,556 1,725
Property 66,015 31,501 9,857 1,992 3,090 1,758 114,213 61,385 52,828
Natural resources 6,696 7,863 9,771 3,655 1,396 4,143 33,524 24,427 9,097
Manufacturing 10,599 8,529 6,744 2,673 917 2,062 31,524 28,088 3,436
Transport (4) 13,842 8,480 5,389 6,161 2,658 6,592 43,122 27,899 15,223
Retail and leisure 24,716 6,663 5,316 1,438 1,174 945 40,252 34,100 6,152
Telecommunication, media and technology 5,495 5,764 3,283 2,187 328 786 17,843 12,076 5,767
Business services 19,364 4,536 6,238 973 1,086 381 32,578 27,985 4,593
315,899 175,637 119,527 39,458 21,026 23,360 694,907 569,524 125,383
2009
Personal 120,193 23,597 37,680 1,374 63 897 183,804 165,143 18,661
Banks 7,850 36,705 4,975 9,121 1,378 2,137 62,166 58,246 3,920
Other financial institutions 14,800 14,125 17,697 4,820 8,441 1,473 61,356 43,762 17,594
Sovereign (3) 18,172 27,421 4,038 3,950 414 2,217 56,212 53,595 2,617
Property 72,768 35,558 11,221 3,507 3,127 1,440 127,621 74,892 52,729
Natural resources 7,876 9,460 9,817 3,029 3,523 4,972 38,677 26,058 12,619
Manufacturing 11,197 14,875 8,718 3,695 1,306 2,633 42,424 33,400 9,024
Transport (4) 14,097 7,033 7,287 5,294 2,604 7,140 43,455 28,362 15,093
Retail and leisure 25,811 8,236 6,148 3,602 1,205 1,691 46,693 35,580 11,113
Telecommunication, media and technology 6,128 8,340 4,854 2,040 680 1,409 23,451 13,645 9,806
Business services 20,497 6,772 6,950 1,137 1,439 903 37,698 32,375 5,323
319,389 192,122 119,385 41,569 24,180 26,912 723,557 565,058 158,499
2008
Personal 116,870 25,802 49,182 2,918 73 1,609 196,454
Banks 11,030 45,656 12,179 8,336 1,693 3,274 82,168
Other financial institutions 25,266 17,481 29,125 5,836 12,892 1,979 92,579
Sovereign (3) 4,755 8,610 3,396 9,032 459 2,837 29,089
Property 78,689 43,777 13,530 5,092 3,750 1,608 146,446
Natural resources 10,092 20,469 15,726 4,366 3,694 8,907 63,254
Manufacturing 14,049 22,416 17,383 5,041 1,848 4,427 65,164
Transport (4) 16,447 12,553 9,320 8,347 3,545 8,572 58,784
Retail and leisure 26,143 11,047 8,060 1,655 871 1,106 48,882
Telecommunication, media and technology 7,483 11,638 12,264 3,171 1,145 2,122 37,823
Business services 20,191 4,863 7,895 667 266 351 34,233
331,015 224,312 178,060 54,461 30,236 36,792 854,876
Notes:
(1) Based on new sector mappings which are aligned to the sector concentration framework.
(2) ‘Other’ comprises Central and Eastern Europe, Middle East, Central Asia and Africa.
(3) Sovereign includes central bank exposures.
(4) Excludes net investment in operating leases in shipping and aviation portfolios as they are accounted for as property, plant and equipment; however, operating leases are included in the monitoring
and management of these portfolios.
*unaudited
RBS Group 2010154
Business review continued