RBS 2010 Annual Report Download - page 104
Download and view the complete annual report
Please find page 104 of the 2010 RBS annual report below. You can navigate through the pages in the report by either clicking on the pages listed below, or by using the keyword search tool below to find specific information within the annual report.-
 1
1 -
2
-
3
-
4
-
5
-
6
-
7
-
8
-
9
-
10
-
11
-
12
-
13
-
14
-
15
-
16
-
17
-
18
-
19
-
20
-
21
-
22
-
23
-
24
-
25
-
26
-
27
-
28
-
29
-
30
-
31
-
32
-
33
-
34
-
35
-
36
-
37
-
38
-
39
-
40
-
41
-
42
-
43
-
44
-
45
-
46
-
47
-
48
-
49
-
50
-
51
-
52
-
53
-
54
-
55
-
56
-
57
-
58
-
59
-
60
-
61
-
62
-
63
-
64
-
65
-
66
-
67
-
68
-
69
-
70
-
71
-
72
-
73
-
74
-
75
-
76
-
77
-
78
-
79
-
80
-
81
-
82
-
83
-
84
-
85
-
86
-
87
-
88
-
89
-
90
-
91
-
92
-
93
-
 94
94 -
 95
95 -
 96
96 -
 97
97 -
 98
98 -
 99
99 -
 100
100 -
 101
101 -
 102
102 -
 103
103 -
 104
104 -
 105
105 -
 106
106 -
 107
107 -
 108
108 -
 109
109 -
 110
110 -
 111
111 -
 112
112 -
 113
113 -
 114
114 -
115
-
116
-
117
-
118
-
119
-
120
-
121
-
122
-
123
-
124
-
125
-
126
-
127
-
128
-
129
-
130
-
131
-
132
-
133
-
134
-
135
-
136
-
137
-
138
-
139
-
140
-
141
-
142
-
143
-
144
-
145
-
146
-
147
-
148
-
149
-
150
-
151
-
152
-
153
-
154
-
155
-
156
-
157
-
158
-
159
-
160
-
161
-
162
-
163
-
164
-
165
-
166
-
167
-
168
-
169
-
170
-
171
-
172
-
173
-
174
-
175
-
176
-
177
-
178
-
179
-
180
-
181
-
182
-
183
-
184
-
185
-
186
-
187
-
188
-
189
-
190
-
191
-
192
-
193
-
194
-
195
-
196
-
197
-
198
-
199
-
200
-
201
-
202
-
203
-
204
-
205
-
206
-
207
-
208
-
209
-
210
-
211
-
212
-
213
-
214
-
215
-
216
-
217
-
218
-
219
-
220
-
221
-
222
-
223
-
224
-
225
-
226
-
227
-
228
-
229
-
230
-
231
-
232
-
233
-
234
-
235
-
236
-
237
-
238
-
239
-
240
-
241
-
242
-
243
-
244
-
245
-
246
-
247
-
248
-
249
-
250
-
251
-
252
-
253
-
254
-
255
-
256
-
257
-
258
-
259
-
260
-
261
-
262
-
263
-
264
-
265
-
266
-
267
-
268
-
269
-
270
-
271
-
272
-
273
-
274
-
275
-
276
-
277
-
278
-
279
-
280
-
281
-
282
-
283
-
284
-
285
-
286
-
287
-
288
-
289
-
290
-
291
-
292
-
293
-
294
-
295
-
296
-
297
-
298
-
299
-
300
-
301
-
302
-
303
-
304
-
305
-
306
-
307
-
308
-
309
-
310
-
311
-
312
-
313
-
314
-
315
-
316
-
317
-
318
-
319
-
320
-
321
-
322
-
323
-
324
-
325
-
326
-
327
-
328
-
329
-
330
-
331
-
332
-
333
-
334
-
335
-
336
-
337
-
338
-
339
-
340
-
341
-
342
-
343
-
344
-
345
-
346
-
347
-
348
-
349
-
350
-
351
-
352
-
353
-
354
-
355
-
356
-
357
-
358
-
359
-
360
-
361
-
362
-
363
-
364
-
365
-
366
-
367
-
368
-
369
-
370
-
371
-
372
-
373
-
374
-
375
-
376
-
377
-
378
-
379
-
380
-
381
-
382
-
383
-
384
-
385
-
386
-
387
-
388
-
389
-
390
-
391
-
392
-
393
-
394
-
395
-
396
-
397
-
398
-
399
-
400
-
401
-
402
-
403
-
404
-
405
-
406
-
407
-
408
-
409
-
410
-
411
-
412
-
413
-
414
-
415
-
416
-
417
-
418
-
419
-
420
-
421
-
422
-
423
-
424
-
425
-
426
-
427
-
428
-
429
-
430
-
431
-
432
-
433
-
434
-
435
-
436
-
437
-
438
-
439
-
440
-
441
-
442
-
443
-
444
-
445
 |
 |

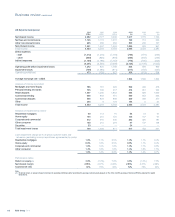
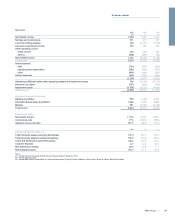
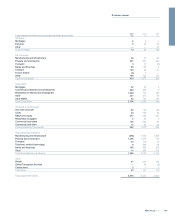
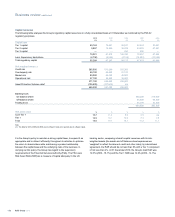
Non-Core continued
2010 2009 2008
£m £m £m
(Loss)/income from trading activities
Monoline exposures (5) (2,387) (3,121)
Credit derivative product companies (139) (947) (615)
Asset-backed products (1) 235 (288) (3,220)
Other credit exotics 77 (558) (935)
Equities (17) (47) (947)
Leveraged finance —— (1,088)
Banking book hedges (82) (1,613) 1,690
Other (2) (100) 679 497
(31) (5,161) (7,739)
Impairment losses
Banking & portfolios 1,311 4,215 938
International businesses & portfolios 4,217 4,494 1,832
Markets (52) 512 2,166
Total impairment losses 5,476 9,221 4,936
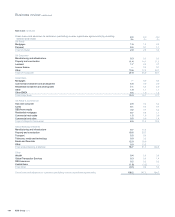
Loan impairment charge as % of gross customer loans and advances (excluding reverse repurchase
agreements) (3)
Banking & portfolios 2.2% 4.9% 0.9%
International businesses & portfolios 7.9% 6.6% 2.3%
Markets 0.1% 5.2% 9.4%
4.9% 5.7% 2.2%
£bn £bn £bn
Gross customer loans and advances
Banking & portfolios 55.6 82.0 97.0
International businesses & portfolios 52.5 65.6 79.9
Markets 0.3 1.9 14.5
108.4 149.5 191.4
Risk-weighted assets
Banking & portfolios 51.2 58.2 63.1
International businesses & portfolios 37.5 43.8 50.1
Markets 65.0 69.3 57.7
153.7 171.3 170.9
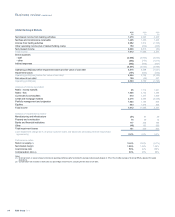
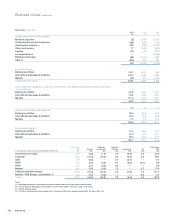
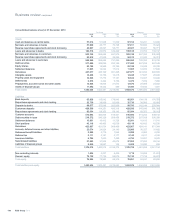
Third party assets (excluding derivatives)
31 December
2009
£bn
Run-off
£bn
Disposals/
restructuring
£bn
Drawings/
roll overs
£bn
Impairments
£bn
FX
£bn
31 December
2010
£bn
Commercial real estate 51.3 (6.2) (1.4) 3.2 (4.6) 0.3 42.6
Corporate 82.6 (12.0) (13.0) 2.0 (0.2) 0.4 59.8
SME 3.9 (0.2) — 0.1 (0.1) — 3.7
Retail 19.9 (7.7) (2.6) 0.1 (0.6) (0.1) 9.0
Other 4.7 (2.1) (0.4) 0.3 — — 2.5
Markets 24.4 (3.0) (9.8) 1.3 — 0.7 13.6
Total (excluding derivatives) 186.8 (31.2) (27.2) 7.0 (5.5) 1.3 131.2
Markets - RBS Sempra Commodities JV 14.2 (1.7) (6.3) — — 0.5 6.7
Total (4) 201.0
(32.9) (33.5) 7.0 (5.5) 1.8 137.9
Notes:
(1) Asset-backed products include super senior asset-backed structures and other asset-backed products.
(2) Includes profits in RBS Sempra Commodities JV of £19 million (2009 - £770 million; 2008 - £764 million).
(3) Includes disposal groups.
(4) £12 billion of disposals have been signed as of 31 December 2010 but are pending closing (2009 - £3 billion; 2008 - nil).
RBS Group 2010102
Business review continued