RBS 2010 Annual Report Download - page 58
Download and view the complete annual report
Please find page 58 of the 2010 RBS annual report below. You can navigate through the pages in the report by either clicking on the pages listed below, or by using the keyword search tool below to find specific information within the annual report.-
 1
1 -
2
-
3
-
4
-
5
-
6
-
7
-
8
-
9
-
10
-
11
-
12
-
13
-
14
-
15
-
16
-
17
-
18
-
19
-
20
-
21
-
22
-
23
-
24
-
25
-
26
-
27
-
28
-
29
-
30
-
31
-
32
-
33
-
34
-
35
-
36
-
37
-
38
-
39
-
40
-
41
-
42
-
43
-
44
-
45
-
46
-
47
-
 48
48 -
 49
49 -
 50
50 -
 51
51 -
 52
52 -
 53
53 -
 54
54 -
 55
55 -
 56
56 -
 57
57 -
 58
58 -
 59
59 -
 60
60 -
 61
61 -
 62
62 -
 63
63 -
 64
64 -
 65
65 -
 66
66 -
 67
67 -
 68
68 -
69
-
70
-
71
-
72
-
73
-
74
-
75
-
76
-
77
-
78
-
79
-
80
-
81
-
82
-
83
-
84
-
85
-
86
-
87
-
88
-
89
-
90
-
91
-
92
-
93
-
94
-
95
-
96
-
97
-
98
-
99
-
100
-
101
-
102
-
103
-
104
-
105
-
106
-
107
-
108
-
109
-
110
-
111
-
112
-
113
-
114
-
115
-
116
-
117
-
118
-
119
-
120
-
121
-
122
-
123
-
124
-
125
-
126
-
127
-
128
-
129
-
130
-
131
-
132
-
133
-
134
-
135
-
136
-
137
-
138
-
139
-
140
-
141
-
142
-
143
-
144
-
145
-
146
-
147
-
148
-
149
-
150
-
151
-
152
-
153
-
154
-
155
-
156
-
157
-
158
-
159
-
160
-
161
-
162
-
163
-
164
-
165
-
166
-
167
-
168
-
169
-
170
-
171
-
172
-
173
-
174
-
175
-
176
-
177
-
178
-
179
-
180
-
181
-
182
-
183
-
184
-
185
-
186
-
187
-
188
-
189
-
190
-
191
-
192
-
193
-
194
-
195
-
196
-
197
-
198
-
199
-
200
-
201
-
202
-
203
-
204
-
205
-
206
-
207
-
208
-
209
-
210
-
211
-
212
-
213
-
214
-
215
-
216
-
217
-
218
-
219
-
220
-
221
-
222
-
223
-
224
-
225
-
226
-
227
-
228
-
229
-
230
-
231
-
232
-
233
-
234
-
235
-
236
-
237
-
238
-
239
-
240
-
241
-
242
-
243
-
244
-
245
-
246
-
247
-
248
-
249
-
250
-
251
-
252
-
253
-
254
-
255
-
256
-
257
-
258
-
259
-
260
-
261
-
262
-
263
-
264
-
265
-
266
-
267
-
268
-
269
-
270
-
271
-
272
-
273
-
274
-
275
-
276
-
277
-
278
-
279
-
280
-
281
-
282
-
283
-
284
-
285
-
286
-
287
-
288
-
289
-
290
-
291
-
292
-
293
-
294
-
295
-
296
-
297
-
298
-
299
-
300
-
301
-
302
-
303
-
304
-
305
-
306
-
307
-
308
-
309
-
310
-
311
-
312
-
313
-
314
-
315
-
316
-
317
-
318
-
319
-
320
-
321
-
322
-
323
-
324
-
325
-
326
-
327
-
328
-
329
-
330
-
331
-
332
-
333
-
334
-
335
-
336
-
337
-
338
-
339
-
340
-
341
-
342
-
343
-
344
-
345
-
346
-
347
-
348
-
349
-
350
-
351
-
352
-
353
-
354
-
355
-
356
-
357
-
358
-
359
-
360
-
361
-
362
-
363
-
364
-
365
-
366
-
367
-
368
-
369
-
370
-
371
-
372
-
373
-
374
-
375
-
376
-
377
-
378
-
379
-
380
-
381
-
382
-
383
-
384
-
385
-
386
-
387
-
388
-
389
-
390
-
391
-
392
-
393
-
394
-
395
-
396
-
397
-
398
-
399
-
400
-
401
-
402
-
403
-
404
-
405
-
406
-
407
-
408
-
409
-
410
-
411
-
412
-
413
-
414
-
415
-
416
-
417
-
418
-
419
-
420
-
421
-
422
-
423
-
424
-
425
-
426
-
427
-
428
-
429
-
430
-
431
-
432
-
433
-
434
-
435
-
436
-
437
-
438
-
439
-
440
-
441
-
442
-
443
-
444
-
445
 |
 |

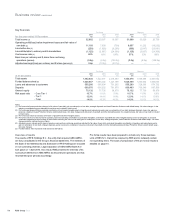
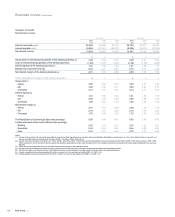
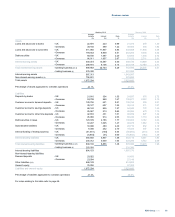
Key financials
Pro forma Statutory
for the year ended 31 December
2010
£m
2009
£m
2008
£m
2010
£m
2009
£m
2008
£m
Total income (1) 32,662 29,567 19,367 31,868 33,026 20,730
Operating profit/(loss) before impairment losses and fair value of
own debt (2) 11,169 7,809 (738) 8,857 11,252 (18,252)
Loss before tax (3) (239) (1,928) (8,296) (399) (2,647) (25,691)
Loss attributable to ordinary and B shareholders (1,125) (3,607) (24,306) (1,125) (3,607) (24,306)
Cost:income ratio (4) 60% 69% 105% 57% 53% 169%
Basic loss per ordinary and B share from continuing
operations (pence) (0.5p) (6.3p) (146.2p) (0.5p) (6.3p) (146.2p)
Adjusted earnings/(loss) per ordinary and B share (pence) (5) 0.6p (13.2p) (43.1p) —— —
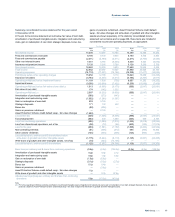
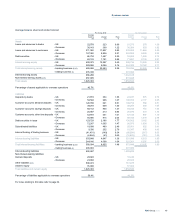
Pro forma Statutory
at 31 December
2010
£m
2009
£m
2008
£m
2010
£m
2009
£m
2008
£m
Total assets 1,452,634 1,522,481 2,218,693 1,453,576 1,696,486 2,401,652
Funded balance sheet (6) 1,025,557 1,084,282 1,227,198 1,026,499 1,255,032 1,409,093
Loans and advances to customers 555,260 595,694 731,265 555,260 728,393 874,722
Deposits 609,370 636,252 781,070 609,483 756,346 897,556
Owners' equity 75,132 77,736 58,879 75,132 77,736 58,879
Risk asset ratio - Core Tier 1 10.7% 11.0% 5.9% 10.7% 11.0% 6.6%
- Tier 1 12.9% 14.4% 9.9% 12.9% 14.1% 10.0%
- Total 14.0% 16.3% 14.2% 14.0% 16.1% 14.1%
Notes:
(1) Pro forma total income excludes changes in fair value of own debt, gain on redemption of own debt, strategic disposals and Asset Protection Scheme credit default swap - fair value changes. In the
statutory consolidated income statement, these items are included in total income.
(2) Pro forma operating profit/(loss) excludes amortisation of purchased intangible assets, integration and restructuring costs, gain on redemption of own debt, strategic disposals, bonus tax, gains on
pensions curtailment, Asset Protection Scheme credit default swap - fair value changes and write-down of goodwill and other intangible assets. On a statutory basis, fair value of own debt is included
in total income.
(3) Pro forma loss before tax excludes write-down of goodwill and other intangible assets.
(4) Pro forma cost:income ratio represents operating expenses excluding amortisation of purchased intangibles, write-down of goodwill and other intangible assets, bonus tax and gains on pensions
curtailment expressed as a percentage of total income excluding fair value of own debt, gain on redemption of own debt, strategic disposals, Asset Protection Scheme credit default swap - fair value
changes and after netting insurance claims.
(5) Adjusted loss per ordinary and B share is based on earnings from continuing operations adjusted for fair value of own debt, purchased intangibles amortisation, integration and restructuring costs,
gain on redemption of own debt, strategic disposals, gains on pensions curtailment, bonus tax, write-down of goodwill and other intangible assets and Asset Protection Scheme credit default swap -
fair value changes.
(6) Funded balance sheet represents total assets less derivatives.
Overview of results
The results of RFS Holdings B.V., the entity that acquired ABN AMRO,
are fully consolidated in the Group’s financial statements. The interests of
the State of the Netherlands and Santander in RFS Holdings are included
in non-controlling interests. Legal separation of ABN AMRO Bank N.V.
took place on 1 April 2010. As a result, RBS presents the interests of its
Consortium Members in ABN AMRO as discontinued operations and has
re-presented prior periods accordingly.
Pro forma results have been prepared to include only those business
units of RBS N.V. that will be retained by RBS and to reclassify certain
non-operating items. The basis of preparation of the pro forma results is
detailed on page 51.
RBS Group 201056
Business review continued