RBS 2010 Annual Report Download - page 191
Download and view the complete annual report
Please find page 191 of the 2010 RBS annual report below. You can navigate through the pages in the report by either clicking on the pages listed below, or by using the keyword search tool below to find specific information within the annual report.-
 1
1 -
2
-
3
-
4
-
5
-
6
-
7
-
8
-
9
-
10
-
11
-
12
-
13
-
14
-
15
-
16
-
17
-
18
-
19
-
20
-
21
-
22
-
23
-
24
-
25
-
26
-
27
-
28
-
29
-
30
-
31
-
32
-
33
-
34
-
35
-
36
-
37
-
38
-
39
-
40
-
41
-
42
-
43
-
44
-
45
-
46
-
47
-
48
-
49
-
50
-
51
-
52
-
53
-
54
-
55
-
56
-
57
-
58
-
59
-
60
-
61
-
62
-
63
-
64
-
65
-
66
-
67
-
68
-
69
-
70
-
71
-
72
-
73
-
74
-
75
-
76
-
77
-
78
-
79
-
80
-
81
-
82
-
83
-
84
-
85
-
86
-
87
-
88
-
89
-
90
-
91
-
92
-
93
-
94
-
95
-
96
-
97
-
98
-
99
-
100
-
101
-
102
-
103
-
104
-
105
-
106
-
107
-
108
-
109
-
110
-
111
-
112
-
113
-
114
-
115
-
116
-
117
-
118
-
119
-
120
-
121
-
122
-
123
-
124
-
125
-
126
-
127
-
128
-
129
-
130
-
131
-
132
-
133
-
134
-
135
-
136
-
137
-
138
-
139
-
140
-
141
-
142
-
143
-
144
-
145
-
146
-
147
-
148
-
149
-
150
-
151
-
152
-
153
-
154
-
155
-
156
-
157
-
158
-
159
-
160
-
161
-
162
-
163
-
164
-
165
-
166
-
167
-
168
-
169
-
170
-
171
-
172
-
173
-
174
-
175
-
176
-
177
-
178
-
179
-
180
-
 181
181 -
 182
182 -
 183
183 -
 184
184 -
 185
185 -
 186
186 -
 187
187 -
 188
188 -
 189
189 -
 190
190 -
 191
191 -
 192
192 -
 193
193 -
 194
194 -
 195
195 -
 196
196 -
 197
197 -
 198
198 -
 199
199 -
 200
200 -
 201
201 -
202
-
203
-
204
-
205
-
206
-
207
-
208
-
209
-
210
-
211
-
212
-
213
-
214
-
215
-
216
-
217
-
218
-
219
-
220
-
221
-
222
-
223
-
224
-
225
-
226
-
227
-
228
-
229
-
230
-
231
-
232
-
233
-
234
-
235
-
236
-
237
-
238
-
239
-
240
-
241
-
242
-
243
-
244
-
245
-
246
-
247
-
248
-
249
-
250
-
251
-
252
-
253
-
254
-
255
-
256
-
257
-
258
-
259
-
260
-
261
-
262
-
263
-
264
-
265
-
266
-
267
-
268
-
269
-
270
-
271
-
272
-
273
-
274
-
275
-
276
-
277
-
278
-
279
-
280
-
281
-
282
-
283
-
284
-
285
-
286
-
287
-
288
-
289
-
290
-
291
-
292
-
293
-
294
-
295
-
296
-
297
-
298
-
299
-
300
-
301
-
302
-
303
-
304
-
305
-
306
-
307
-
308
-
309
-
310
-
311
-
312
-
313
-
314
-
315
-
316
-
317
-
318
-
319
-
320
-
321
-
322
-
323
-
324
-
325
-
326
-
327
-
328
-
329
-
330
-
331
-
332
-
333
-
334
-
335
-
336
-
337
-
338
-
339
-
340
-
341
-
342
-
343
-
344
-
345
-
346
-
347
-
348
-
349
-
350
-
351
-
352
-
353
-
354
-
355
-
356
-
357
-
358
-
359
-
360
-
361
-
362
-
363
-
364
-
365
-
366
-
367
-
368
-
369
-
370
-
371
-
372
-
373
-
374
-
375
-
376
-
377
-
378
-
379
-
380
-
381
-
382
-
383
-
384
-
385
-
386
-
387
-
388
-
389
-
390
-
391
-
392
-
393
-
394
-
395
-
396
-
397
-
398
-
399
-
400
-
401
-
402
-
403
-
404
-
405
-
406
-
407
-
408
-
409
-
410
-
411
-
412
-
413
-
414
-
415
-
416
-
417
-
418
-
419
-
420
-
421
-
422
-
423
-
424
-
425
-
426
-
427
-
428
-
429
-
430
-
431
-
432
-
433
-
434
-
435
-
436
-
437
-
438
-
439
-
440
-
441
-
442
-
443
-
444
-
445
 |
 |

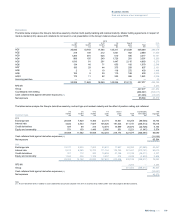
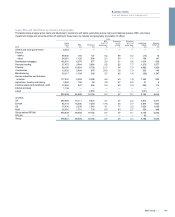
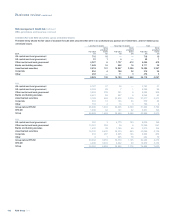
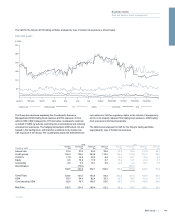
Movement in loan impairment provisions
The movement in provisions balance by division is shown in the table below.
UK
Retail
UK
Corporate Wealth GTS (1)
Ulster
Bank
US
R&C (2)
Total
R&C (2) GBM (3)
Total
Core Non-Core RFS MI Group
2010 £m £m £m £m £m £m £m £m £m £m £m £m
At 1 January 2,677 1,271 55 189 962 478 5,632 1,289 6,921 8,252 2,110 17,283
Intra-group transfers — — — — (351) — (351) (217) (568) 568 — —
Transfer to disposal
groups —————— — — — (72) — (72)
Currency translation
and other adjustments —71 4 (2) (22) 19 70 (86) (16) 59 — 43
Disposal of subsidiaries —————— — — — (20) (2,152) (2,172)
Amounts written-off (1,135) (349) (9) (49) (48) (547) (2,137) (87) (2,224) (3,818) — (6,042)
Recoveries of amounts
previously written-off 128 8 — 1 1 72 210 3 213 198 — 411
Charged to the income
statement
-continuing operations 1,160 761 18 8 1,161 483 3,591 146 3,737 5,407 — 9,144
- discontinued operations — — — — — — — — — — 42 42
Unwind of discount (89) (30) (2) — (70) — (191) (6) (197) (258) — (455)
At 31 December 2,741 1,732 66 147 1,633 505 6,824 1,042 7,866 10,316 — 18,182
Individually assessed
-banks — — 2 7 — — 9 117 126 1 — 127
- customers —546 57 111 502 56 1,272 676 1,948 8,161 — 10,109
Collectively assessed 2,526 689 — 14 733 177 4,139 — 4,139 1,157 — 5,296
Latent 215 497 7 15 398 272 1,404 249 1,653 997 — 2,650
2,741 1,732 66 147 1,633 505 6,824 1,042 7,866 10,316 — 18,182
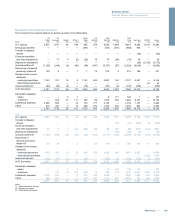
2009
At 1 January 2,086 696 34 43 491 298 3,648 621 4,269 5,182 1,565 11,016
Transfer to disposal
groups ——————
—
(16) (16) (305) (3) (324)
Currency translation
and other adjustments 67 5 1 128 (109) (34) 58 365 423 (851) (102) (530)
Disposal of subsidiaries — — — — — — — (62) (62) (3) — (65)
Amounts written-off (1,150) (352) (12) (23) (34) (546) (2,117) (169) (2,286) (4,192) (461) (6,939)
Recoveries of
amounts previously
written-off 97 20 — 2 1 58 178 11 189 136 74 399
Charged to the income
statement
-continuing operations 1,679 923 33 39 649 702 4,025 542 4,567 8,523 — 13,090
- discontinued operations — — — — — — — — — — 1,044 1,044
Unwind of discount (102) (21) (1) — (36) — (160) (3) (163) (238) (7) (408)
At 31 December 2,677 1,271 55 189 962 478 5,632 1,289 6,921 8,252 2,110 17,283
Individually assessed
-banks — — 2 8 — — 10 125 135 22 — 157
- customers —205 44 156 280 14 699 573 1,272 6,229 1,295 8,796
Collectively assessed 2,475 475 — 17 412 130 3,509 — 3,509 1,266 479 5,254
Latent 202 591 9 8 270 334 1,414 591 2,005 735 336 3,076
2,677 1,271 55 189 962 478 5,632 1,289 6,921 8,252 2,110 17,283
Notes:
(1) Global Transaction Services.
(2) Retail & Commercial.
(3) Global Banking & Markets.
189RBS Group 2010
Business review
Risk and balance sheet management