RBS 2010 Annual Report Download - page 393
Download and view the complete annual report
Please find page 393 of the 2010 RBS annual report below. You can navigate through the pages in the report by either clicking on the pages listed below, or by using the keyword search tool below to find specific information within the annual report.-
 1
1 -
2
-
3
-
4
-
5
-
6
-
7
-
8
-
9
-
10
-
11
-
12
-
13
-
14
-
15
-
16
-
17
-
18
-
19
-
20
-
21
-
22
-
23
-
24
-
25
-
26
-
27
-
28
-
29
-
30
-
31
-
32
-
33
-
34
-
35
-
36
-
37
-
38
-
39
-
40
-
41
-
42
-
43
-
44
-
45
-
46
-
47
-
48
-
49
-
50
-
51
-
52
-
53
-
54
-
55
-
56
-
57
-
58
-
59
-
60
-
61
-
62
-
63
-
64
-
65
-
66
-
67
-
68
-
69
-
70
-
71
-
72
-
73
-
74
-
75
-
76
-
77
-
78
-
79
-
80
-
81
-
82
-
83
-
84
-
85
-
86
-
87
-
88
-
89
-
90
-
91
-
92
-
93
-
94
-
95
-
96
-
97
-
98
-
99
-
100
-
101
-
102
-
103
-
104
-
105
-
106
-
107
-
108
-
109
-
110
-
111
-
112
-
113
-
114
-
115
-
116
-
117
-
118
-
119
-
120
-
121
-
122
-
123
-
124
-
125
-
126
-
127
-
128
-
129
-
130
-
131
-
132
-
133
-
134
-
135
-
136
-
137
-
138
-
139
-
140
-
141
-
142
-
143
-
144
-
145
-
146
-
147
-
148
-
149
-
150
-
151
-
152
-
153
-
154
-
155
-
156
-
157
-
158
-
159
-
160
-
161
-
162
-
163
-
164
-
165
-
166
-
167
-
168
-
169
-
170
-
171
-
172
-
173
-
174
-
175
-
176
-
177
-
178
-
179
-
180
-
181
-
182
-
183
-
184
-
185
-
186
-
187
-
188
-
189
-
190
-
191
-
192
-
193
-
194
-
195
-
196
-
197
-
198
-
199
-
200
-
201
-
202
-
203
-
204
-
205
-
206
-
207
-
208
-
209
-
210
-
211
-
212
-
213
-
214
-
215
-
216
-
217
-
218
-
219
-
220
-
221
-
222
-
223
-
224
-
225
-
226
-
227
-
228
-
229
-
230
-
231
-
232
-
233
-
234
-
235
-
236
-
237
-
238
-
239
-
240
-
241
-
242
-
243
-
244
-
245
-
246
-
247
-
248
-
249
-
250
-
251
-
252
-
253
-
254
-
255
-
256
-
257
-
258
-
259
-
260
-
261
-
262
-
263
-
264
-
265
-
266
-
267
-
268
-
269
-
270
-
271
-
272
-
273
-
274
-
275
-
276
-
277
-
278
-
279
-
280
-
281
-
282
-
283
-
284
-
285
-
286
-
287
-
288
-
289
-
290
-
291
-
292
-
293
-
294
-
295
-
296
-
297
-
298
-
299
-
300
-
301
-
302
-
303
-
304
-
305
-
306
-
307
-
308
-
309
-
310
-
311
-
312
-
313
-
314
-
315
-
316
-
317
-
318
-
319
-
320
-
321
-
322
-
323
-
324
-
325
-
326
-
327
-
328
-
329
-
330
-
331
-
332
-
333
-
334
-
335
-
336
-
337
-
338
-
339
-
340
-
341
-
342
-
343
-
344
-
345
-
346
-
347
-
348
-
349
-
350
-
351
-
352
-
353
-
354
-
355
-
356
-
357
-
358
-
359
-
360
-
361
-
362
-
363
-
364
-
365
-
366
-
367
-
368
-
369
-
370
-
371
-
372
-
373
-
374
-
375
-
376
-
377
-
378
-
379
-
380
-
381
-
382
-
 383
383 -
 384
384 -
 385
385 -
 386
386 -
 387
387 -
 388
388 -
 389
389 -
 390
390 -
 391
391 -
 392
392 -
 393
393 -
 394
394 -
 395
395 -
 396
396 -
 397
397 -
 398
398 -
 399
399 -
 400
400 -
 401
401 -
 402
402 -
 403
403 -
404
-
405
-
406
-
407
-
408
-
409
-
410
-
411
-
412
-
413
-
414
-
415
-
416
-
417
-
418
-
419
-
420
-
421
-
422
-
423
-
424
-
425
-
426
-
427
-
428
-
429
-
430
-
431
-
432
-
433
-
434
-
435
-
436
-
437
-
438
-
439
-
440
-
441
-
442
-
443
-
444
-
445
 |
 |

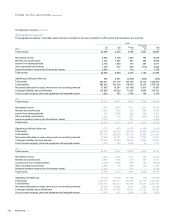
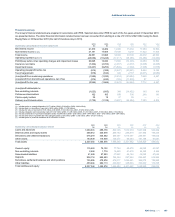
The following table shows additional information in respect of loan impairment provisions.
2010
£m
2009
£m
2008
£m
2007
£m
2006
£m
Loan impairment provisions at end of year
Customers 18,055 17,126 10,889 6,449 3,933
Banks 127 157 127 3 2
18,182 17,283 11,016 6,452 3,935
Average loans and advances to customers (gross) 610,131 821,155 858,333 567,900 445,766
As a % of average loans and advances to customers during the year
Total customer provisions charged to income statement 1.5% 1.6% 0.7% 0.4% 0.4%
Amounts written-off (net of recoveries) - customers 0.9% 0.8% 0.3% 0.3% 0.4%
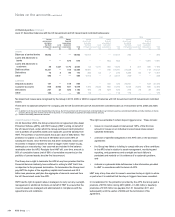
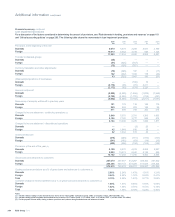
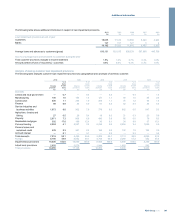
Analysis of closing customer loan impairment provisions
The following table analyses customer loan impairment provisions by geographical area and type of domestic customer.
2010 2009 2008 2007 2006
Closing
provision
%of
loans
to total
loans
Closing
provision
%of
loans
to total
loans
Closing
provision
%of
loans
to total
loans
Closing
provision
%of
loans
to total
loans
Closing
provision
%of
loans
to total
loans
£m % £m % £m % £m % £m %
Domestic
Central and local government —0.7 —0.4 — 0.3 — 0.4 — 1.4
Manufacturing 100 1.6 153 1.5 127 1.7 93 1.6 94 2.4
Construction 605 1.1 355 1.0 254 1.1 75 1.2 63 1.8
Finance 98 6.8 26 4.9 67 4.8 52 8.4 33 5.3
Service industries and
business activities 1,073 8.0 962 7.0 778 6.6 562 6.5 647 9.3
Agriculture, forestry and
fishing 27 0.5 20 0.4 19 0.3 21 0.3 25 0.6
Property 2,071 7.3 908 6.6 490 5.9 85 6.0 70 8.3
Residential mortgages 302 17.6 196 12.4 36 9.1 36 8.8 37 15.1
Personal lending 2,504 4.1 2,527 3.4 2,235 3.0 2,054 3.4 1,826 5.9
Finance leases and
instalment credit 435 2.3 341 2.2 194 2.0 132 1.9 103 3.0
Accrued interest —0.1 —0.1 — 0.3 — 0.3 — 0.3
Total domestic 7,215 50.1 5,488 39.9 4,200 35.1 3,110 38.8 2,898 53.4
Foreign 8,190 49.9 8,562 60.1 4,745 64.9 2,289 61.2 442 46.6
Impaired book provisions 15,405 100.0 14,050 100.0 8,945 100.0 5,399 100.0 3,340 100.0
Latent book provisions 2,650
3,076 1,944 1,050 593
Total provisions 18,055 17,126 10,889 6,449 3,933
391RBS Group 2010
Additional information