RBS 2010 Annual Report Download - page 381
Download and view the complete annual report
Please find page 381 of the 2010 RBS annual report below. You can navigate through the pages in the report by either clicking on the pages listed below, or by using the keyword search tool below to find specific information within the annual report.-
 1
1 -
2
-
3
-
4
-
5
-
6
-
7
-
8
-
9
-
10
-
11
-
12
-
13
-
14
-
15
-
16
-
17
-
18
-
19
-
20
-
21
-
22
-
23
-
24
-
25
-
26
-
27
-
28
-
29
-
30
-
31
-
32
-
33
-
34
-
35
-
36
-
37
-
38
-
39
-
40
-
41
-
42
-
43
-
44
-
45
-
46
-
47
-
48
-
49
-
50
-
51
-
52
-
53
-
54
-
55
-
56
-
57
-
58
-
59
-
60
-
61
-
62
-
63
-
64
-
65
-
66
-
67
-
68
-
69
-
70
-
71
-
72
-
73
-
74
-
75
-
76
-
77
-
78
-
79
-
80
-
81
-
82
-
83
-
84
-
85
-
86
-
87
-
88
-
89
-
90
-
91
-
92
-
93
-
94
-
95
-
96
-
97
-
98
-
99
-
100
-
101
-
102
-
103
-
104
-
105
-
106
-
107
-
108
-
109
-
110
-
111
-
112
-
113
-
114
-
115
-
116
-
117
-
118
-
119
-
120
-
121
-
122
-
123
-
124
-
125
-
126
-
127
-
128
-
129
-
130
-
131
-
132
-
133
-
134
-
135
-
136
-
137
-
138
-
139
-
140
-
141
-
142
-
143
-
144
-
145
-
146
-
147
-
148
-
149
-
150
-
151
-
152
-
153
-
154
-
155
-
156
-
157
-
158
-
159
-
160
-
161
-
162
-
163
-
164
-
165
-
166
-
167
-
168
-
169
-
170
-
171
-
172
-
173
-
174
-
175
-
176
-
177
-
178
-
179
-
180
-
181
-
182
-
183
-
184
-
185
-
186
-
187
-
188
-
189
-
190
-
191
-
192
-
193
-
194
-
195
-
196
-
197
-
198
-
199
-
200
-
201
-
202
-
203
-
204
-
205
-
206
-
207
-
208
-
209
-
210
-
211
-
212
-
213
-
214
-
215
-
216
-
217
-
218
-
219
-
220
-
221
-
222
-
223
-
224
-
225
-
226
-
227
-
228
-
229
-
230
-
231
-
232
-
233
-
234
-
235
-
236
-
237
-
238
-
239
-
240
-
241
-
242
-
243
-
244
-
245
-
246
-
247
-
248
-
249
-
250
-
251
-
252
-
253
-
254
-
255
-
256
-
257
-
258
-
259
-
260
-
261
-
262
-
263
-
264
-
265
-
266
-
267
-
268
-
269
-
270
-
271
-
272
-
273
-
274
-
275
-
276
-
277
-
278
-
279
-
280
-
281
-
282
-
283
-
284
-
285
-
286
-
287
-
288
-
289
-
290
-
291
-
292
-
293
-
294
-
295
-
296
-
297
-
298
-
299
-
300
-
301
-
302
-
303
-
304
-
305
-
306
-
307
-
308
-
309
-
310
-
311
-
312
-
313
-
314
-
315
-
316
-
317
-
318
-
319
-
320
-
321
-
322
-
323
-
324
-
325
-
326
-
327
-
328
-
329
-
330
-
331
-
332
-
333
-
334
-
335
-
336
-
337
-
338
-
339
-
340
-
341
-
342
-
343
-
344
-
345
-
346
-
347
-
348
-
349
-
350
-
351
-
352
-
353
-
354
-
355
-
356
-
357
-
358
-
359
-
360
-
361
-
362
-
363
-
364
-
365
-
366
-
367
-
368
-
369
-
370
-
 371
371 -
 372
372 -
 373
373 -
 374
374 -
 375
375 -
 376
376 -
 377
377 -
 378
378 -
 379
379 -
 380
380 -
 381
381 -
 382
382 -
 383
383 -
 384
384 -
 385
385 -
 386
386 -
 387
387 -
 388
388 -
 389
389 -
 390
390 -
 391
391 -
392
-
393
-
394
-
395
-
396
-
397
-
398
-
399
-
400
-
401
-
402
-
403
-
404
-
405
-
406
-
407
-
408
-
409
-
410
-
411
-
412
-
413
-
414
-
415
-
416
-
417
-
418
-
419
-
420
-
421
-
422
-
423
-
424
-
425
-
426
-
427
-
428
-
429
-
430
-
431
-
432
-
433
-
434
-
435
-
436
-
437
-
438
-
439
-
440
-
441
-
442
-
443
-
444
-
445
 |
 |

Group
2008
Net
interest
income
£m
Non-interest
income
£m
Total
income
£m
Operating
expenses
and
insurance
claims
£m
Depreciation
and
amortisation
£m
Impairment
losses
£m
Operating
profit/(loss)
£m
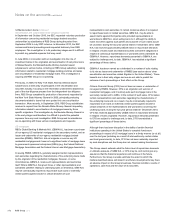
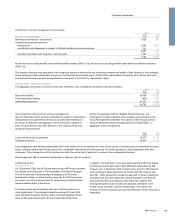
UK Retail 3,187 1,935 5,122 (3,378) (2) (1,019) 723
UK Corporate 2,448 1,289 3,737 (1,487) (150) (319) 1,781
Wealth 578 481 1,059 (686) (9) (16) 348
Global Transaction Services 937 1,494 2,431 (1,372) (3) (54) 1,002
Ulster Bank 708 331 1,039 (715) — (106) 218
US Retail & Commercial 1,726 861 2,587 (1,471) (151) (437) 528
Global Banking & Markets 2,326 31 2,357 (3,736) (252) (522) (2,153)
RBS Insurance 496 3,934 4,430 (3,767) (37) (42) 584
Central items 1,710 (2,073) (363) 1,179 (685) 19 150
Core 14,116 8,283 22,399 (15,433) (1,289) (2,496) 3,181
Non-Core 1,648 (4,680) (3,032) (2,840) (543) (4,936) (11,351)
15,764 3,603 19,367 (18,273) (1,832) (7,432) (8,170)
Reconciling items
RFS Holdings minority interest (282) (29) (311) (100) (66) (7) (484)
Fair value of own debt —1,232 1,232 — — — 1,232
Amortisation of purchased intangible assets — — — — (443) — (443)
Integration and restructuring costs — — — (1,321) (36) — (1,357)
Strategic disposals —442 442 — — — 442
Write-down of goodwill and other intangible assets — — — (16,911) — — (16,911)
15,482 5,248 20,730 (36,605) (2,377) (7,439) (25,691)
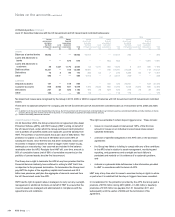
2010 2009 2008
Total income External
£m
Inter
segment
£m
Total
£m
External
£m
Inter
segment
£m
Total
£m
External
£m
Inter
segment
£m
Total
£m
UK Retail 5,513 (23) 5,490 5,157 (76) 5,081 5,499 (377) 5,122
UK Corporate 4,345 (450) 3,895 4,422 (840) 3,582 6,372 (2,635) 3,737
Wealth 562 494 1,056 409 700 1,109 (761) 1,820 1,059
Global Transaction Services 2,428 133 2,561 2,438 49 2,487 1,967 464 2,431
Ulster Bank 865 110 975 1,003 31 1,034 1,315 (276) 1,039
US Retail & Commercial 2,672 274 2,946 2,380 344 2,724 2,141 446 2,587
Global Banking & Markets 7,817 95 7,912 10,174 884 11,058 979 1,378 2,357
RBS Insurance 4,417 (48) 4,369 4,475 (15) 4,460 4,413 17 4,430
Central items (400) 825 425 (1,577) 1,910 333 (4,042) 3,679 (363)
Core 28,219 1,410 29,629 28,881 2,987 31,868 17,883 4,516 22,399
Non-Core 4,451 (1,418) 3,033 616 (2,917) (2,301) 1,620 (4,652) (3,032)
32,670 (8) 32,662 29,497 70 29,567 19,503 (136) 19,367
Reconciling items
RFS Holdings minority interest (150) 8 (142) (251) (70) (321) (447) 136 (311)
Fair value of own debt 174 — 174 (142) — (142) 1,232 — 1,232
Gain on redemption of own debt 553 — 553 3,790 — 3,790 — — —
Strategic disposals 171 — 171 132 — 132 442 — 442
Asset Protection Scheme credit default swap
- fair value changes (1,550) — (1,550) —— — — — —
31,868 — 31,868
33,026 — 33,026 20,730 — 20,730
379RBS Group 2010
Financial statements