RBS 2010 Annual Report Download - page 194
Download and view the complete annual report
Please find page 194 of the 2010 RBS annual report below. You can navigate through the pages in the report by either clicking on the pages listed below, or by using the keyword search tool below to find specific information within the annual report.-
 1
1 -
2
-
3
-
4
-
5
-
6
-
7
-
8
-
9
-
10
-
11
-
12
-
13
-
14
-
15
-
16
-
17
-
18
-
19
-
20
-
21
-
22
-
23
-
24
-
25
-
26
-
27
-
28
-
29
-
30
-
31
-
32
-
33
-
34
-
35
-
36
-
37
-
38
-
39
-
40
-
41
-
42
-
43
-
44
-
45
-
46
-
47
-
48
-
49
-
50
-
51
-
52
-
53
-
54
-
55
-
56
-
57
-
58
-
59
-
60
-
61
-
62
-
63
-
64
-
65
-
66
-
67
-
68
-
69
-
70
-
71
-
72
-
73
-
74
-
75
-
76
-
77
-
78
-
79
-
80
-
81
-
82
-
83
-
84
-
85
-
86
-
87
-
88
-
89
-
90
-
91
-
92
-
93
-
94
-
95
-
96
-
97
-
98
-
99
-
100
-
101
-
102
-
103
-
104
-
105
-
106
-
107
-
108
-
109
-
110
-
111
-
112
-
113
-
114
-
115
-
116
-
117
-
118
-
119
-
120
-
121
-
122
-
123
-
124
-
125
-
126
-
127
-
128
-
129
-
130
-
131
-
132
-
133
-
134
-
135
-
136
-
137
-
138
-
139
-
140
-
141
-
142
-
143
-
144
-
145
-
146
-
147
-
148
-
149
-
150
-
151
-
152
-
153
-
154
-
155
-
156
-
157
-
158
-
159
-
160
-
161
-
162
-
163
-
164
-
165
-
166
-
167
-
168
-
169
-
170
-
171
-
172
-
173
-
174
-
175
-
176
-
177
-
178
-
179
-
180
-
181
-
182
-
183
-
 184
184 -
 185
185 -
 186
186 -
 187
187 -
 188
188 -
 189
189 -
 190
190 -
 191
191 -
 192
192 -
 193
193 -
 194
194 -
 195
195 -
 196
196 -
 197
197 -
 198
198 -
 199
199 -
 200
200 -
 201
201 -
 202
202 -
 203
203 -
 204
204 -
205
-
206
-
207
-
208
-
209
-
210
-
211
-
212
-
213
-
214
-
215
-
216
-
217
-
218
-
219
-
220
-
221
-
222
-
223
-
224
-
225
-
226
-
227
-
228
-
229
-
230
-
231
-
232
-
233
-
234
-
235
-
236
-
237
-
238
-
239
-
240
-
241
-
242
-
243
-
244
-
245
-
246
-
247
-
248
-
249
-
250
-
251
-
252
-
253
-
254
-
255
-
256
-
257
-
258
-
259
-
260
-
261
-
262
-
263
-
264
-
265
-
266
-
267
-
268
-
269
-
270
-
271
-
272
-
273
-
274
-
275
-
276
-
277
-
278
-
279
-
280
-
281
-
282
-
283
-
284
-
285
-
286
-
287
-
288
-
289
-
290
-
291
-
292
-
293
-
294
-
295
-
296
-
297
-
298
-
299
-
300
-
301
-
302
-
303
-
304
-
305
-
306
-
307
-
308
-
309
-
310
-
311
-
312
-
313
-
314
-
315
-
316
-
317
-
318
-
319
-
320
-
321
-
322
-
323
-
324
-
325
-
326
-
327
-
328
-
329
-
330
-
331
-
332
-
333
-
334
-
335
-
336
-
337
-
338
-
339
-
340
-
341
-
342
-
343
-
344
-
345
-
346
-
347
-
348
-
349
-
350
-
351
-
352
-
353
-
354
-
355
-
356
-
357
-
358
-
359
-
360
-
361
-
362
-
363
-
364
-
365
-
366
-
367
-
368
-
369
-
370
-
371
-
372
-
373
-
374
-
375
-
376
-
377
-
378
-
379
-
380
-
381
-
382
-
383
-
384
-
385
-
386
-
387
-
388
-
389
-
390
-
391
-
392
-
393
-
394
-
395
-
396
-
397
-
398
-
399
-
400
-
401
-
402
-
403
-
404
-
405
-
406
-
407
-
408
-
409
-
410
-
411
-
412
-
413
-
414
-
415
-
416
-
417
-
418
-
419
-
420
-
421
-
422
-
423
-
424
-
425
-
426
-
427
-
428
-
429
-
430
-
431
-
432
-
433
-
434
-
435
-
436
-
437
-
438
-
439
-
440
-
441
-
442
-
443
-
444
-
445
 |
 |

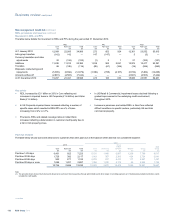
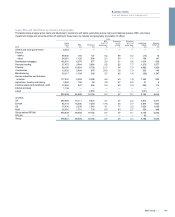
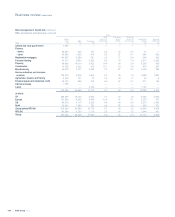
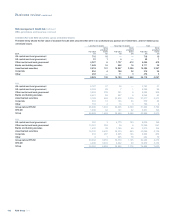
Risk management: Credit risk continued
REIL, provisions and reserves continued
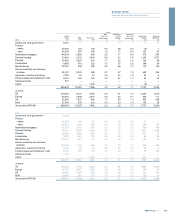
Available-for-sale debt securities: gross unrealised losses
The table belowshows the fair value of available-for-sale debt securities that were in an unrealised loss position at 31 December, and the related gross
unrealised losses.
Less than 12 months More than 12 months Total
Gross Gross Gross
unrealised unrealised unrealised
Fair value losses Fair value losses Fair value losses
2010 £m £m £m £m £m £m
UK central and local government 716 10 — — 716 10
US central and local government 51 1 4 — 55 1
Other central and local government 4,327 6 1,737 612 6,064 618
Banks and building societies 1,649 16 462 16 2,111 32
Asset backed securities 2,519 101 12,867 3,296 15,386 3,397
Corporate 204 4 108 32 312 36
Other 463 — 11 3 474 3
9,929 138 15,189 3,959 25,118 4,097
2009
UK central and local government 2,727 57 26 — 2,753 57
US central and local government 5,349 88 7 1 5,356 89
Other central and local government 5,863 203 391 6 6,254 209
Banks and building societies 8,421 56 827 6 9,248 62
Asset backed securities 3,185 983 23,832 2,330 27,017 3,313
Corporate 384 14 166 34 550 48
Other 710 3 16 3 726 6
Group before RFS MI 26,639 1,404 25,265 2,380 51,904 3,784
RFS MI 1,890 64 161 62 2,051 126
Group 28,529 1,468 25,426 2,442 53,955 3,910
2008
US central and local government 260 3 4,770 163 5,030 166
Other central and local government 13,341 555 39 6 13,380 561
Banks and building societies 1,402 95 1,168 49 2,570 144
Asset backed securities 15,032 2,432 25,033 693 40,065 3,125
Corporate 618 267 2,325 136 2,943 403
Other 9 1 235 78 244 79
Group before RFS MI 30,662 3,353 33,570 1,125 64,232 4,478
RFS MI 4,598 3,303 6,032 49 10,630 3,352
Group 35,260 6,656 39,602 1,174 74,862 7,830
RBS Group 2010192
Business review continued