RBS 2010 Annual Report Download - page 185
Download and view the complete annual report
Please find page 185 of the 2010 RBS annual report below. You can navigate through the pages in the report by either clicking on the pages listed below, or by using the keyword search tool below to find specific information within the annual report.-
 1
1 -
2
-
3
-
4
-
5
-
6
-
7
-
8
-
9
-
10
-
11
-
12
-
13
-
14
-
15
-
16
-
17
-
18
-
19
-
20
-
21
-
22
-
23
-
24
-
25
-
26
-
27
-
28
-
29
-
30
-
31
-
32
-
33
-
34
-
35
-
36
-
37
-
38
-
39
-
40
-
41
-
42
-
43
-
44
-
45
-
46
-
47
-
48
-
49
-
50
-
51
-
52
-
53
-
54
-
55
-
56
-
57
-
58
-
59
-
60
-
61
-
62
-
63
-
64
-
65
-
66
-
67
-
68
-
69
-
70
-
71
-
72
-
73
-
74
-
75
-
76
-
77
-
78
-
79
-
80
-
81
-
82
-
83
-
84
-
85
-
86
-
87
-
88
-
89
-
90
-
91
-
92
-
93
-
94
-
95
-
96
-
97
-
98
-
99
-
100
-
101
-
102
-
103
-
104
-
105
-
106
-
107
-
108
-
109
-
110
-
111
-
112
-
113
-
114
-
115
-
116
-
117
-
118
-
119
-
120
-
121
-
122
-
123
-
124
-
125
-
126
-
127
-
128
-
129
-
130
-
131
-
132
-
133
-
134
-
135
-
136
-
137
-
138
-
139
-
140
-
141
-
142
-
143
-
144
-
145
-
146
-
147
-
148
-
149
-
150
-
151
-
152
-
153
-
154
-
155
-
156
-
157
-
158
-
159
-
160
-
161
-
162
-
163
-
164
-
165
-
166
-
167
-
168
-
169
-
170
-
171
-
172
-
173
-
174
-
 175
175 -
 176
176 -
 177
177 -
 178
178 -
 179
179 -
 180
180 -
 181
181 -
 182
182 -
 183
183 -
 184
184 -
 185
185 -
 186
186 -
 187
187 -
 188
188 -
 189
189 -
 190
190 -
 191
191 -
 192
192 -
 193
193 -
 194
194 -
 195
195 -
196
-
197
-
198
-
199
-
200
-
201
-
202
-
203
-
204
-
205
-
206
-
207
-
208
-
209
-
210
-
211
-
212
-
213
-
214
-
215
-
216
-
217
-
218
-
219
-
220
-
221
-
222
-
223
-
224
-
225
-
226
-
227
-
228
-
229
-
230
-
231
-
232
-
233
-
234
-
235
-
236
-
237
-
238
-
239
-
240
-
241
-
242
-
243
-
244
-
245
-
246
-
247
-
248
-
249
-
250
-
251
-
252
-
253
-
254
-
255
-
256
-
257
-
258
-
259
-
260
-
261
-
262
-
263
-
264
-
265
-
266
-
267
-
268
-
269
-
270
-
271
-
272
-
273
-
274
-
275
-
276
-
277
-
278
-
279
-
280
-
281
-
282
-
283
-
284
-
285
-
286
-
287
-
288
-
289
-
290
-
291
-
292
-
293
-
294
-
295
-
296
-
297
-
298
-
299
-
300
-
301
-
302
-
303
-
304
-
305
-
306
-
307
-
308
-
309
-
310
-
311
-
312
-
313
-
314
-
315
-
316
-
317
-
318
-
319
-
320
-
321
-
322
-
323
-
324
-
325
-
326
-
327
-
328
-
329
-
330
-
331
-
332
-
333
-
334
-
335
-
336
-
337
-
338
-
339
-
340
-
341
-
342
-
343
-
344
-
345
-
346
-
347
-
348
-
349
-
350
-
351
-
352
-
353
-
354
-
355
-
356
-
357
-
358
-
359
-
360
-
361
-
362
-
363
-
364
-
365
-
366
-
367
-
368
-
369
-
370
-
371
-
372
-
373
-
374
-
375
-
376
-
377
-
378
-
379
-
380
-
381
-
382
-
383
-
384
-
385
-
386
-
387
-
388
-
389
-
390
-
391
-
392
-
393
-
394
-
395
-
396
-
397
-
398
-
399
-
400
-
401
-
402
-
403
-
404
-
405
-
406
-
407
-
408
-
409
-
410
-
411
-
412
-
413
-
414
-
415
-
416
-
417
-
418
-
419
-
420
-
421
-
422
-
423
-
424
-
425
-
426
-
427
-
428
-
429
-
430
-
431
-
432
-
433
-
434
-
435
-
436
-
437
-
438
-
439
-
440
-
441
-
442
-
443
-
444
-
445
 |
 |

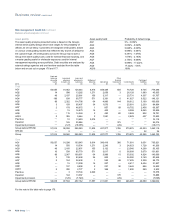
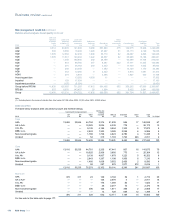
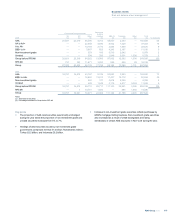
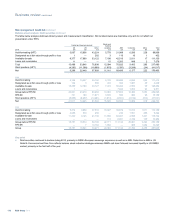
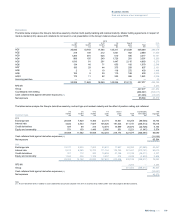
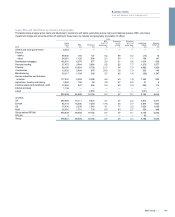
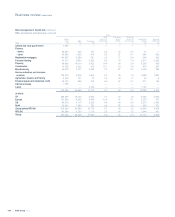
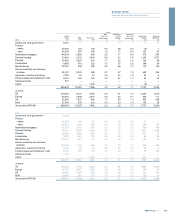
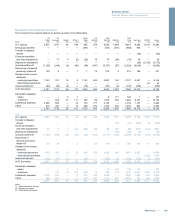
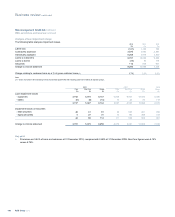
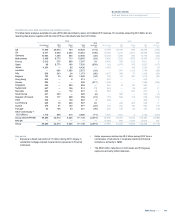
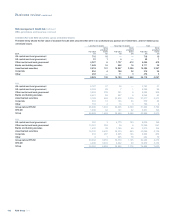
Loans, REIL and impairments by industry and geography
The tables below analyse gross loans and advances to customers and banks (excluding reverse repos and disposal groups), REIL, provisions,
impairment charge and amounts written-off relating to these loans, by industry and geography (by location of office).
Total
2010
Gross
loans
£m
REIL
£m
Provisions
£m
REIL
as a % of
gross loans
%
Provisions
as a %
of REIL
%
Provisions
as a % of
gross loans
%
Impairment
charge
£m
Amounts
written-off
£m
Central and local government 8,452 — — — — — — —
Finance
-banks 58,036 145 127 0.2 88 0.2 (13) 12
- other 54,561 1,129 595 2.1 53 1.1 198 141
Residential mortgages 146,501 4,276 877 2.9 21 0.6 1,014 669
Personal lending 37,472 3,544 2,894 9.5 82 7.7 1,370 1,577
Property 90,106 19,584 6,736 21.7 34 7.5 4,682 1,009
Construction 12,032 2,464 875 20.5 36 7.3 530 146
Manufacturing 32,317 1,199 503 3.7 42 1.6 (92) 1,547
Service industries and business
activities 117,510 5,258 2,285 4.5 43 1.9 1,293 822
Agriculture, forestry and fishing 3,893 152 86 3.9 57 2.2 31 6
Finance leases and instalment credit 16,850 847 554 5.0 65 3.3 252 113
Interest accruals 1,109 — — — — — — —
Latent — — 2,650 — — — (121) —
578,839 38,598 18,182 6.7 47 3.1 9,144 6,042
of which:
UK 382,609 18,111 8,537 4.7 47 2.2 3,912 2,271
Europe 94,119 16,436 7,270 17.5 44 7.7 3,878 1,663
US 75,430 2,330 1,643 3.1 71 2.2 1,020 1,660
RoW 26,681 1,721 732 6.5 43 2.7 334 448
Group before RFS MI 578,839 38,598 18,182 6.7 47 3.1 9,144 6,042
RFS MI 2 — — — — — 42 —
Group 578,841 38,598 18,182 6.7 47 3.1 9,186 6,042
183RBS Group 2010
Business review
Risk and balance sheet management