RBS 2010 Annual Report Download - page 287
Download and view the complete annual report
Please find page 287 of the 2010 RBS annual report below. You can navigate through the pages in the report by either clicking on the pages listed below, or by using the keyword search tool below to find specific information within the annual report.-
 1
1 -
2
-
3
-
4
-
5
-
6
-
7
-
8
-
9
-
10
-
11
-
12
-
13
-
14
-
15
-
16
-
17
-
18
-
19
-
20
-
21
-
22
-
23
-
24
-
25
-
26
-
27
-
28
-
29
-
30
-
31
-
32
-
33
-
34
-
35
-
36
-
37
-
38
-
39
-
40
-
41
-
42
-
43
-
44
-
45
-
46
-
47
-
48
-
49
-
50
-
51
-
52
-
53
-
54
-
55
-
56
-
57
-
58
-
59
-
60
-
61
-
62
-
63
-
64
-
65
-
66
-
67
-
68
-
69
-
70
-
71
-
72
-
73
-
74
-
75
-
76
-
77
-
78
-
79
-
80
-
81
-
82
-
83
-
84
-
85
-
86
-
87
-
88
-
89
-
90
-
91
-
92
-
93
-
94
-
95
-
96
-
97
-
98
-
99
-
100
-
101
-
102
-
103
-
104
-
105
-
106
-
107
-
108
-
109
-
110
-
111
-
112
-
113
-
114
-
115
-
116
-
117
-
118
-
119
-
120
-
121
-
122
-
123
-
124
-
125
-
126
-
127
-
128
-
129
-
130
-
131
-
132
-
133
-
134
-
135
-
136
-
137
-
138
-
139
-
140
-
141
-
142
-
143
-
144
-
145
-
146
-
147
-
148
-
149
-
150
-
151
-
152
-
153
-
154
-
155
-
156
-
157
-
158
-
159
-
160
-
161
-
162
-
163
-
164
-
165
-
166
-
167
-
168
-
169
-
170
-
171
-
172
-
173
-
174
-
175
-
176
-
177
-
178
-
179
-
180
-
181
-
182
-
183
-
184
-
185
-
186
-
187
-
188
-
189
-
190
-
191
-
192
-
193
-
194
-
195
-
196
-
197
-
198
-
199
-
200
-
201
-
202
-
203
-
204
-
205
-
206
-
207
-
208
-
209
-
210
-
211
-
212
-
213
-
214
-
215
-
216
-
217
-
218
-
219
-
220
-
221
-
222
-
223
-
224
-
225
-
226
-
227
-
228
-
229
-
230
-
231
-
232
-
233
-
234
-
235
-
236
-
237
-
238
-
239
-
240
-
241
-
242
-
243
-
244
-
245
-
246
-
247
-
248
-
249
-
250
-
251
-
252
-
253
-
254
-
255
-
256
-
257
-
258
-
259
-
260
-
261
-
262
-
263
-
264
-
265
-
266
-
267
-
268
-
269
-
270
-
271
-
272
-
273
-
274
-
275
-
276
-
 277
277 -
 278
278 -
 279
279 -
 280
280 -
 281
281 -
 282
282 -
 283
283 -
 284
284 -
 285
285 -
 286
286 -
 287
287 -
 288
288 -
 289
289 -
 290
290 -
 291
291 -
 292
292 -
 293
293 -
 294
294 -
 295
295 -
 296
296 -
 297
297 -
298
-
299
-
300
-
301
-
302
-
303
-
304
-
305
-
306
-
307
-
308
-
309
-
310
-
311
-
312
-
313
-
314
-
315
-
316
-
317
-
318
-
319
-
320
-
321
-
322
-
323
-
324
-
325
-
326
-
327
-
328
-
329
-
330
-
331
-
332
-
333
-
334
-
335
-
336
-
337
-
338
-
339
-
340
-
341
-
342
-
343
-
344
-
345
-
346
-
347
-
348
-
349
-
350
-
351
-
352
-
353
-
354
-
355
-
356
-
357
-
358
-
359
-
360
-
361
-
362
-
363
-
364
-
365
-
366
-
367
-
368
-
369
-
370
-
371
-
372
-
373
-
374
-
375
-
376
-
377
-
378
-
379
-
380
-
381
-
382
-
383
-
384
-
385
-
386
-
387
-
388
-
389
-
390
-
391
-
392
-
393
-
394
-
395
-
396
-
397
-
398
-
399
-
400
-
401
-
402
-
403
-
404
-
405
-
406
-
407
-
408
-
409
-
410
-
411
-
412
-
413
-
414
-
415
-
416
-
417
-
418
-
419
-
420
-
421
-
422
-
423
-
424
-
425
-
426
-
427
-
428
-
429
-
430
-
431
-
432
-
433
-
434
-
435
-
436
-
437
-
438
-
439
-
440
-
441
-
442
-
443
-
444
-
445
 |
 |

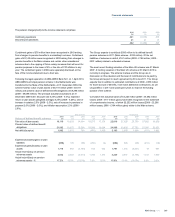
General insurance claims
The Group makes provision for the full cost of settling outstanding claims
arising from its general insurance business at the balance sheet date,
including claims estimated to have been incurred but not yet reported at
that date and claims handling expenses. General insurance claims
provisions amounted to £6,726 million at 31 December 2010 (2009 -
£5,802 million; 2008 - £5,478 million).
Provisions are determined by management based on experience of
claims settled and on statistical models which require certain
assumptions to be made regarding the incidence, timing and amount of
claims and any specific factors such as adverse weather conditions. In
order to calculate the total provision required, the historical development
of claims is analysed using statistical methodology to extrapolate, within
acceptable probability parameters, the value of outstanding claims at the
balance sheet date. Also included in the estimation of outstanding claims
are other assumptions such as the inflationary factor used for bodily
injury claims which is based on historical trends and, therefore, allows for
some increase due to changes in common law and statute; and the
incidence of periodical payment orders and the rate at which payments
under them are discounted. Costs for both direct and indirect claims
handling expenses are also included. Outward reinsurance recoveries
are accounted for in the same accounting period as the direct claims to
which they relate. The outstanding claims provision is based on
information available to management and the eventual outcome may vary
from the original assessment. Actual claims experience may differ from
the historical pattern on which the estimate is based and the cost of
settling individual claims may exceed that assumed.
Deferred tax
The Group makes provision for deferred tax on short-term and other
temporary differences where tax recognition occurs at a different time
from accounting recognition. Deferred tax assets of £6,373 million were
recognised as at 31 December 2010 (2009 - £7,039 million; 2008 -
£7,082 million).
The Group has recognised deferred tax assets in respect of losses,
principally in the UK, and short-term timing differences. Deferred tax
assets are recognised in respect of unused tax losses to the extent that it
is probable that there will be future taxable profits against which the
losses can be utilised. Business projections prepared for impairment
reviews (see Note 19) indicate that sufficient future taxable income will be
available against which to offset these recognised deferred tax assets
within eight years (2009 - eight years). The Group's cumulative losses are
principally attributable to the recent unparalleled market conditions.
Deferred tax assets of £2,008 million (2009 - £2,163 million; 2008 -
£1,748 million) have not been recognised in respect of tax losses carried
forward in jurisdictions where doubt exists over the availability of future
taxable profits.
285RBS Group 2010
Financial statements