RBS 2010 Annual Report Download - page 114
Download and view the complete annual report
Please find page 114 of the 2010 RBS annual report below. You can navigate through the pages in the report by either clicking on the pages listed below, or by using the keyword search tool below to find specific information within the annual report.-
 1
1 -
2
-
3
-
4
-
5
-
6
-
7
-
8
-
9
-
10
-
11
-
12
-
13
-
14
-
15
-
16
-
17
-
18
-
19
-
20
-
21
-
22
-
23
-
24
-
25
-
26
-
27
-
28
-
29
-
30
-
31
-
32
-
33
-
34
-
35
-
36
-
37
-
38
-
39
-
40
-
41
-
42
-
43
-
44
-
45
-
46
-
47
-
48
-
49
-
50
-
51
-
52
-
53
-
54
-
55
-
56
-
57
-
58
-
59
-
60
-
61
-
62
-
63
-
64
-
65
-
66
-
67
-
68
-
69
-
70
-
71
-
72
-
73
-
74
-
75
-
76
-
77
-
78
-
79
-
80
-
81
-
82
-
83
-
84
-
85
-
86
-
87
-
88
-
89
-
90
-
91
-
92
-
93
-
94
-
95
-
96
-
97
-
98
-
99
-
100
-
101
-
102
-
103
-
 104
104 -
 105
105 -
 106
106 -
 107
107 -
 108
108 -
 109
109 -
 110
110 -
 111
111 -
 112
112 -
 113
113 -
 114
114 -
 115
115 -
 116
116 -
 117
117 -
 118
118 -
 119
119 -
 120
120 -
 121
121 -
 122
122 -
 123
123 -
 124
124 -
125
-
126
-
127
-
128
-
129
-
130
-
131
-
132
-
133
-
134
-
135
-
136
-
137
-
138
-
139
-
140
-
141
-
142
-
143
-
144
-
145
-
146
-
147
-
148
-
149
-
150
-
151
-
152
-
153
-
154
-
155
-
156
-
157
-
158
-
159
-
160
-
161
-
162
-
163
-
164
-
165
-
166
-
167
-
168
-
169
-
170
-
171
-
172
-
173
-
174
-
175
-
176
-
177
-
178
-
179
-
180
-
181
-
182
-
183
-
184
-
185
-
186
-
187
-
188
-
189
-
190
-
191
-
192
-
193
-
194
-
195
-
196
-
197
-
198
-
199
-
200
-
201
-
202
-
203
-
204
-
205
-
206
-
207
-
208
-
209
-
210
-
211
-
212
-
213
-
214
-
215
-
216
-
217
-
218
-
219
-
220
-
221
-
222
-
223
-
224
-
225
-
226
-
227
-
228
-
229
-
230
-
231
-
232
-
233
-
234
-
235
-
236
-
237
-
238
-
239
-
240
-
241
-
242
-
243
-
244
-
245
-
246
-
247
-
248
-
249
-
250
-
251
-
252
-
253
-
254
-
255
-
256
-
257
-
258
-
259
-
260
-
261
-
262
-
263
-
264
-
265
-
266
-
267
-
268
-
269
-
270
-
271
-
272
-
273
-
274
-
275
-
276
-
277
-
278
-
279
-
280
-
281
-
282
-
283
-
284
-
285
-
286
-
287
-
288
-
289
-
290
-
291
-
292
-
293
-
294
-
295
-
296
-
297
-
298
-
299
-
300
-
301
-
302
-
303
-
304
-
305
-
306
-
307
-
308
-
309
-
310
-
311
-
312
-
313
-
314
-
315
-
316
-
317
-
318
-
319
-
320
-
321
-
322
-
323
-
324
-
325
-
326
-
327
-
328
-
329
-
330
-
331
-
332
-
333
-
334
-
335
-
336
-
337
-
338
-
339
-
340
-
341
-
342
-
343
-
344
-
345
-
346
-
347
-
348
-
349
-
350
-
351
-
352
-
353
-
354
-
355
-
356
-
357
-
358
-
359
-
360
-
361
-
362
-
363
-
364
-
365
-
366
-
367
-
368
-
369
-
370
-
371
-
372
-
373
-
374
-
375
-
376
-
377
-
378
-
379
-
380
-
381
-
382
-
383
-
384
-
385
-
386
-
387
-
388
-
389
-
390
-
391
-
392
-
393
-
394
-
395
-
396
-
397
-
398
-
399
-
400
-
401
-
402
-
403
-
404
-
405
-
406
-
407
-
408
-
409
-
410
-
411
-
412
-
413
-
414
-
415
-
416
-
417
-
418
-
419
-
420
-
421
-
422
-
423
-
424
-
425
-
426
-
427
-
428
-
429
-
430
-
431
-
432
-
433
-
434
-
435
-
436
-
437
-
438
-
439
-
440
-
441
-
442
-
443
-
444
-
445
 |
 |

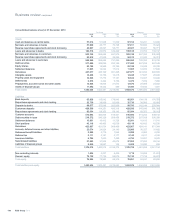
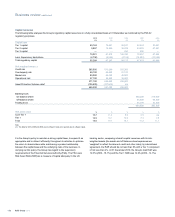
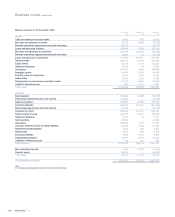
Capital resources
The following table analyses the Group's regulatory capital resources on a fully consolidated basis at 31 December as monitored by the FSA for
regulatory purposes.
2010 2009 2008 2007 2006
£m £m £m £m £m
Capital base
Tier 1 capital 60,124 76,421 69,847 44,364 30,041
Tier 2 capital 9,897 15,389 32,223 33,693 27,491
Tier 3 capital ——260 200 —
70,021 91,810 102,330 78,257 57,532
Less: Supervisory deductions (4,732) (4,565) (4,155) (10,283) (10,583)
Total regulatory capital 65,289 87,245 98,175 67,974 46,949
Risk-weighted assets (1)
Credit risk 385,900 513,200 551,300
Counterparty risk 68,100 56,500 61,100
Market risk 80,000 65,000 46,500
Operational risk 37,100 33,900 36,900
571,100 668,600 695,800
Asset Protection Scheme relief (105,600) (127,600) n/a
465,500 541,000 695,800
Banking book:
On-balance sheet 480,200 318,600
Off-balance sheet 84,600 59,400
Trading book 44,200 22,300
609,000 400,300
Risk asset ratios %% % % %
Core Tier 1 10.7 11.0 6.6 4.5 n/a
Tier 1 12.9 14.1 10.0 7.3 7.5
Total 14.0 16.1 14.1 11.2 11.7
Note:
(1) The data for 2010, 2009 and 2008 are on a Basel II basis; prior periods are on a Basel I basis.
It is the Group's policy to maintain a strong capital base, to expand it as
appropriate and to utilise it efficiently throughout its activities to optimise
the return to shareholders while maintaining a prudent relationship
between the capital base and the underlying risks of the business. In
carrying out this policy, the Group has regard to the supervisory
requirements of the Financial Services Authority (FSA). The FSA uses
Risk Asset Ratio (RAR) as a measure of capital adequacy in the UK
banking sector, comparing a bank's capital resources with its risk-
weighted assets (the assets and off-balance sheet exposures are
'weighted' to reflect the inherent credit and other risks); by international
agreement, the RAR should be not less than 8% with a Tier 1 component
of not less than 4%. At 31 December 2010, the Group's total RAR was
14.0% (2009 - 16.1%) and the Tier 1 RAR was 12.9% (2009 - 14.1%).
RBS Group 2010112
Business review continued