RBS 2010 Annual Report Download - page 59
Download and view the complete annual report
Please find page 59 of the 2010 RBS annual report below. You can navigate through the pages in the report by either clicking on the pages listed below, or by using the keyword search tool below to find specific information within the annual report.-
 1
1 -
2
-
3
-
4
-
5
-
6
-
7
-
8
-
9
-
10
-
11
-
12
-
13
-
14
-
15
-
16
-
17
-
18
-
19
-
20
-
21
-
22
-
23
-
24
-
25
-
26
-
27
-
28
-
29
-
30
-
31
-
32
-
33
-
34
-
35
-
36
-
37
-
38
-
39
-
40
-
41
-
42
-
43
-
44
-
45
-
46
-
47
-
48
-
 49
49 -
 50
50 -
 51
51 -
 52
52 -
 53
53 -
 54
54 -
 55
55 -
 56
56 -
 57
57 -
 58
58 -
 59
59 -
 60
60 -
 61
61 -
 62
62 -
 63
63 -
 64
64 -
 65
65 -
 66
66 -
 67
67 -
 68
68 -
 69
69 -
70
-
71
-
72
-
73
-
74
-
75
-
76
-
77
-
78
-
79
-
80
-
81
-
82
-
83
-
84
-
85
-
86
-
87
-
88
-
89
-
90
-
91
-
92
-
93
-
94
-
95
-
96
-
97
-
98
-
99
-
100
-
101
-
102
-
103
-
104
-
105
-
106
-
107
-
108
-
109
-
110
-
111
-
112
-
113
-
114
-
115
-
116
-
117
-
118
-
119
-
120
-
121
-
122
-
123
-
124
-
125
-
126
-
127
-
128
-
129
-
130
-
131
-
132
-
133
-
134
-
135
-
136
-
137
-
138
-
139
-
140
-
141
-
142
-
143
-
144
-
145
-
146
-
147
-
148
-
149
-
150
-
151
-
152
-
153
-
154
-
155
-
156
-
157
-
158
-
159
-
160
-
161
-
162
-
163
-
164
-
165
-
166
-
167
-
168
-
169
-
170
-
171
-
172
-
173
-
174
-
175
-
176
-
177
-
178
-
179
-
180
-
181
-
182
-
183
-
184
-
185
-
186
-
187
-
188
-
189
-
190
-
191
-
192
-
193
-
194
-
195
-
196
-
197
-
198
-
199
-
200
-
201
-
202
-
203
-
204
-
205
-
206
-
207
-
208
-
209
-
210
-
211
-
212
-
213
-
214
-
215
-
216
-
217
-
218
-
219
-
220
-
221
-
222
-
223
-
224
-
225
-
226
-
227
-
228
-
229
-
230
-
231
-
232
-
233
-
234
-
235
-
236
-
237
-
238
-
239
-
240
-
241
-
242
-
243
-
244
-
245
-
246
-
247
-
248
-
249
-
250
-
251
-
252
-
253
-
254
-
255
-
256
-
257
-
258
-
259
-
260
-
261
-
262
-
263
-
264
-
265
-
266
-
267
-
268
-
269
-
270
-
271
-
272
-
273
-
274
-
275
-
276
-
277
-
278
-
279
-
280
-
281
-
282
-
283
-
284
-
285
-
286
-
287
-
288
-
289
-
290
-
291
-
292
-
293
-
294
-
295
-
296
-
297
-
298
-
299
-
300
-
301
-
302
-
303
-
304
-
305
-
306
-
307
-
308
-
309
-
310
-
311
-
312
-
313
-
314
-
315
-
316
-
317
-
318
-
319
-
320
-
321
-
322
-
323
-
324
-
325
-
326
-
327
-
328
-
329
-
330
-
331
-
332
-
333
-
334
-
335
-
336
-
337
-
338
-
339
-
340
-
341
-
342
-
343
-
344
-
345
-
346
-
347
-
348
-
349
-
350
-
351
-
352
-
353
-
354
-
355
-
356
-
357
-
358
-
359
-
360
-
361
-
362
-
363
-
364
-
365
-
366
-
367
-
368
-
369
-
370
-
371
-
372
-
373
-
374
-
375
-
376
-
377
-
378
-
379
-
380
-
381
-
382
-
383
-
384
-
385
-
386
-
387
-
388
-
389
-
390
-
391
-
392
-
393
-
394
-
395
-
396
-
397
-
398
-
399
-
400
-
401
-
402
-
403
-
404
-
405
-
406
-
407
-
408
-
409
-
410
-
411
-
412
-
413
-
414
-
415
-
416
-
417
-
418
-
419
-
420
-
421
-
422
-
423
-
424
-
425
-
426
-
427
-
428
-
429
-
430
-
431
-
432
-
433
-
434
-
435
-
436
-
437
-
438
-
439
-
440
-
441
-
442
-
443
-
444
-
445
 |
 |

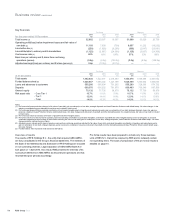
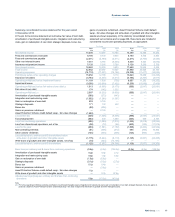
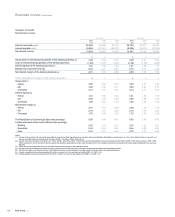
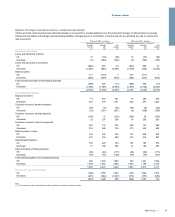
Summary consolidated income statement for the year ended
31 December 2010
In the pro forma income statement set out below, fair value of own debt,
amortisation of purchased intangible assets, integration and restructuring
costs, gain on redemption of own debt, strategic disposals, bonus tax,
gains on pensions curtailment, Asset Protection Scheme credit default
swap - fair value changes and write-down of goodwill and other intangible
assets are shown separately. In the statutory consolidated income
statement set out below and on page 268, these items are included in
non-interest income and operating expenses, as appropriate.
Pro forma Statutory
2010 2009 2008 2010 2009 2008
£m £m £m £m £m £m
Net interest income 14,200 13,567 15,764 14,209 13,388 15,482
Fees and commissions receivable 8,194 8,738 8,845 8,193 8,738 8,855
Fees and commissions payable (2,211) (2,790) (2,411) (2,211) (2,790) (2,444)
Other non-interest income 7,351 4,786 (8,540) 6,549 8,424 (6,872)
Insurance net premium income 5,128 5,266 5,709 5,128 5,266 5,709
Non-interest income 18,462 16,000 3,603 17,659 19,638 5,248
Total income 32,662 29,567 19,367 31,868 33,026 20,730
Operating expenses (16,710) (17,401) (16,188) (18,228) (17,417) (35,065)
Profit/(loss) before other operating charges 15,952 12,166 3,179 13,640 15,609 (14,335)
Insurance net claims (4,783) (4,357) (3,917) (4,783) (4,357) (3,917)
Operating profit/(loss) before impairment losses 11,169 7,809 (738) 8,857 11,252 (18,252)
Impairment losses (9,256) (13,899) (7,432) (9,256) (13,899) (7,439)
Operating profit/(loss) before fair value of own debt (1) 1,913 (6,090) (8,170) (399) (2,647) (25,691)
Fair value of own debt 174 (142) 1,232 —— —
Operating profit/(loss) (1) 2,087 (6,232) (6,938) (399) (2,647) (25,691)
Amortisation of purchased intangible assets (369) (272) (443) —— —
Integration and restructuring costs (1,032) (1,286) (1,357) —— —
Gain on redemption of own debt 553 3,790 — —— —
Strategic disposals 171 132 442 —— —
Bonus tax (99) (208) — —— —
Gains on pensions curtailment —2,148 — —— —
Asset Protection Scheme credit default swap - fair value changes (1,550) — — —— —
Loss before tax (239) (1,928) (8,296) (399) (2,647) (25,691)
Tax (charge)/credit (663) 339 1,280 (634) 429 2,167
Loss from continuing operations (902) (1,589) (7,016) (1,033) (2,218) (23,524)
Loss from discontinued operations, net of tax (28) (72) (86) (633) (105) (11,018)
Loss for the year (930) (1,661) (7,102) (1,666) (2,323) (34,542)
Non-controlling interests (61) (648) (412) 665 (349) 10,832
Other owners’ dividends (124) (935) (596) (124) (935) (596)
Loss attributable to ordinary and B shareholders before
write-down of goodwill and other intangible assets (1,115) (3,244) (8,110) (1,125) (3,607) (24,306)
Write-down of goodwill and other intangible assets, net of tax (10) (363) (16,196) —— —
Loss attributable to ordinary and B shareholders (1,125) (3,607) (24,306) (1,125) (3,607) (24,306)
Basic loss per ordinary and B share from continuing operations (0.5p) (6.3p) (146.2p) (0.5p) (6.3p) (146.2p)
Amortisation of purchased intangible assets 0.2p 0.4p 2.1p
Integration and restructuring costs 0.8p 1.6p 5.9p
Gain on redemption of own debt (1.0p) (6.8p) —
Strategic disposals (0.1p) (0.2p) (2.7p)
Bonus tax 0.1p 0.4p —
Gains on pensions curtailment —(3.0p) —
Asset Protection Scheme credit default swap - fair value changes 1.1p — —
Write-down of goodwill and other intangible assets —0.7p 97.8p
Adjusted earnings/(loss) per ordinary and B share from continuing
operations 0.6p (13.2p) (43.1p)
Note:
(1) Pro forma operating profit/(loss) excludes amortisation of purchased intangible assets, integration and restructuring costs, gain on redemption of own debt, strategic disposals, bonus tax, gains on
pensions curtailment, Asset Protection Scheme credit default swap - fair value changes and write-down of goodwill and other intangible assets.
57RBS Group 2010
Business review