RBS 2010 Annual Report Download - page 332
Download and view the complete annual report
Please find page 332 of the 2010 RBS annual report below. You can navigate through the pages in the report by either clicking on the pages listed below, or by using the keyword search tool below to find specific information within the annual report.-
 1
1 -
2
-
3
-
4
-
5
-
6
-
7
-
8
-
9
-
10
-
11
-
12
-
13
-
14
-
15
-
16
-
17
-
18
-
19
-
20
-
21
-
22
-
23
-
24
-
25
-
26
-
27
-
28
-
29
-
30
-
31
-
32
-
33
-
34
-
35
-
36
-
37
-
38
-
39
-
40
-
41
-
42
-
43
-
44
-
45
-
46
-
47
-
48
-
49
-
50
-
51
-
52
-
53
-
54
-
55
-
56
-
57
-
58
-
59
-
60
-
61
-
62
-
63
-
64
-
65
-
66
-
67
-
68
-
69
-
70
-
71
-
72
-
73
-
74
-
75
-
76
-
77
-
78
-
79
-
80
-
81
-
82
-
83
-
84
-
85
-
86
-
87
-
88
-
89
-
90
-
91
-
92
-
93
-
94
-
95
-
96
-
97
-
98
-
99
-
100
-
101
-
102
-
103
-
104
-
105
-
106
-
107
-
108
-
109
-
110
-
111
-
112
-
113
-
114
-
115
-
116
-
117
-
118
-
119
-
120
-
121
-
122
-
123
-
124
-
125
-
126
-
127
-
128
-
129
-
130
-
131
-
132
-
133
-
134
-
135
-
136
-
137
-
138
-
139
-
140
-
141
-
142
-
143
-
144
-
145
-
146
-
147
-
148
-
149
-
150
-
151
-
152
-
153
-
154
-
155
-
156
-
157
-
158
-
159
-
160
-
161
-
162
-
163
-
164
-
165
-
166
-
167
-
168
-
169
-
170
-
171
-
172
-
173
-
174
-
175
-
176
-
177
-
178
-
179
-
180
-
181
-
182
-
183
-
184
-
185
-
186
-
187
-
188
-
189
-
190
-
191
-
192
-
193
-
194
-
195
-
196
-
197
-
198
-
199
-
200
-
201
-
202
-
203
-
204
-
205
-
206
-
207
-
208
-
209
-
210
-
211
-
212
-
213
-
214
-
215
-
216
-
217
-
218
-
219
-
220
-
221
-
222
-
223
-
224
-
225
-
226
-
227
-
228
-
229
-
230
-
231
-
232
-
233
-
234
-
235
-
236
-
237
-
238
-
239
-
240
-
241
-
242
-
243
-
244
-
245
-
246
-
247
-
248
-
249
-
250
-
251
-
252
-
253
-
254
-
255
-
256
-
257
-
258
-
259
-
260
-
261
-
262
-
263
-
264
-
265
-
266
-
267
-
268
-
269
-
270
-
271
-
272
-
273
-
274
-
275
-
276
-
277
-
278
-
279
-
280
-
281
-
282
-
283
-
284
-
285
-
286
-
287
-
288
-
289
-
290
-
291
-
292
-
293
-
294
-
295
-
296
-
297
-
298
-
299
-
300
-
301
-
302
-
303
-
304
-
305
-
306
-
307
-
308
-
309
-
310
-
311
-
312
-
313
-
314
-
315
-
316
-
317
-
318
-
319
-
320
-
321
-
 322
322 -
 323
323 -
 324
324 -
 325
325 -
 326
326 -
 327
327 -
 328
328 -
 329
329 -
 330
330 -
 331
331 -
 332
332 -
 333
333 -
 334
334 -
 335
335 -
 336
336 -
 337
337 -
 338
338 -
 339
339 -
 340
340 -
 341
341 -
 342
342 -
343
-
344
-
345
-
346
-
347
-
348
-
349
-
350
-
351
-
352
-
353
-
354
-
355
-
356
-
357
-
358
-
359
-
360
-
361
-
362
-
363
-
364
-
365
-
366
-
367
-
368
-
369
-
370
-
371
-
372
-
373
-
374
-
375
-
376
-
377
-
378
-
379
-
380
-
381
-
382
-
383
-
384
-
385
-
386
-
387
-
388
-
389
-
390
-
391
-
392
-
393
-
394
-
395
-
396
-
397
-
398
-
399
-
400
-
401
-
402
-
403
-
404
-
405
-
406
-
407
-
408
-
409
-
410
-
411
-
412
-
413
-
414
-
415
-
416
-
417
-
418
-
419
-
420
-
421
-
422
-
423
-
424
-
425
-
426
-
427
-
428
-
429
-
430
-
431
-
432
-
433
-
434
-
435
-
436
-
437
-
438
-
439
-
440
-
441
-
442
-
443
-
444
-
445
 |
 |

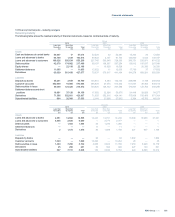
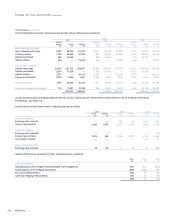
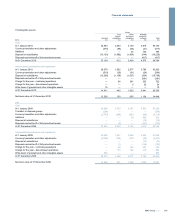
15 Derivatives continued
The following table shows the notional amounts and fair values of the Group's derivatives.
Group
2010
2009 2008
Notional Notional Notional
amount Assets Liabilities amount Assets Liabilities amount Assets Liabilities
£bn £m £m £bn £m £m £bn £m £m
Exchange rate contracts
Spot, forwards and futures 2,807 39,859 41,424 2,004 26,744 24,898 2,316 83,065 83,568
Currency swaps 1,000 28,696 34,328 922 25,883 23,466 1,074 53,398 54,728
Options purchased 503 14,698 — 440 16,656 — 616 36,762 —
Options written 544 — 13,623 476 — 15,555 668 — 35,017
Interest rate contracts
Interest rate swaps 29,792 251,312 243,807 30,956 265,528 253,793 37,901 548,040 532,180
Options purchased 2,619 57,359 — 3,180 55,976 — 5,673 99,192 —
Options written 2,731 — 54,141
2,539 — 55,589 3,775 — 102,216
Futures and forwards 4,618 3,060 1,261 6,555 2,088 2,033 8,555 7,600 6,620
Credit derivatives 1,357 26,872 25,344 1,621 41,748 39,127 2,208 142,366 132,734
Equity and commodity contracts 179 5,221 10,039 188 6,831 9,680 622 22,136 24,301
427,077 423,967 441,454 424,141 992,559 971,364
Certain derivative asset and liability balances with the London Clearing House, which meet the offset criteria in IAS 32 ‘Financial Instruments:
Presentation’, are shown net.
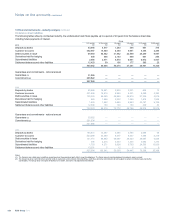
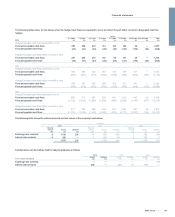
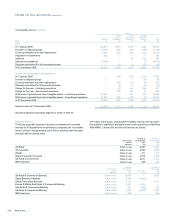
Included above are derivatives held for hedging purposes as follows:
2010 2009 2008
Assets Liabilities Assets Liabilities Assets Liabilities
£m £m £m £m £m £m
Fair value hedging
Exchange rate contracts —— 160 38 1,257 1,412
Interest rate contracts 2,496 3,767 2,672 3,292 2,944 3,330
Cash flow hedging
Exchange rate contracts —— 2 7 2 90
Interest rate contracts 2,903 995 1,753 3,080 2,503 2,834
Commodity contracts —— — — 39 14
Net investment hedging
Exchange rate contracts 30 102 10 90 114 596
Hedge ineffectiveness recognised in other operating income comprised:
2010 2009 2008
£m £m £m
Fair value hedging
Gains/(losses) on the hedged items attributable to the hedged risk 343 512 (965)
(Losses)/gains on the hedging instruments (405) (455) 884
Fair value ineffectiveness (62) 57 (81)
Cash flow hedging ineffectiveness (37) 14 (16)
(99) 71 (97)
RBS Group 2010330
Notes on the accounts continued