RBS 2010 Annual Report Download - page 43
Download and view the complete annual report
Please find page 43 of the 2010 RBS annual report below. You can navigate through the pages in the report by either clicking on the pages listed below, or by using the keyword search tool below to find specific information within the annual report.-
 1
1 -
2
-
3
-
4
-
5
-
6
-
7
-
8
-
9
-
10
-
11
-
12
-
13
-
14
-
15
-
16
-
17
-
18
-
19
-
20
-
21
-
22
-
23
-
24
-
25
-
26
-
27
-
28
-
29
-
30
-
31
-
32
-
 33
33 -
 34
34 -
 35
35 -
 36
36 -
 37
37 -
 38
38 -
 39
39 -
 40
40 -
 41
41 -
 42
42 -
 43
43 -
 44
44 -
 45
45 -
 46
46 -
 47
47 -
 48
48 -
 49
49 -
 50
50 -
 51
51 -
 52
52 -
 53
53 -
54
-
55
-
56
-
57
-
58
-
59
-
60
-
61
-
62
-
63
-
64
-
65
-
66
-
67
-
68
-
69
-
70
-
71
-
72
-
73
-
74
-
75
-
76
-
77
-
78
-
79
-
80
-
81
-
82
-
83
-
84
-
85
-
86
-
87
-
88
-
89
-
90
-
91
-
92
-
93
-
94
-
95
-
96
-
97
-
98
-
99
-
100
-
101
-
102
-
103
-
104
-
105
-
106
-
107
-
108
-
109
-
110
-
111
-
112
-
113
-
114
-
115
-
116
-
117
-
118
-
119
-
120
-
121
-
122
-
123
-
124
-
125
-
126
-
127
-
128
-
129
-
130
-
131
-
132
-
133
-
134
-
135
-
136
-
137
-
138
-
139
-
140
-
141
-
142
-
143
-
144
-
145
-
146
-
147
-
148
-
149
-
150
-
151
-
152
-
153
-
154
-
155
-
156
-
157
-
158
-
159
-
160
-
161
-
162
-
163
-
164
-
165
-
166
-
167
-
168
-
169
-
170
-
171
-
172
-
173
-
174
-
175
-
176
-
177
-
178
-
179
-
180
-
181
-
182
-
183
-
184
-
185
-
186
-
187
-
188
-
189
-
190
-
191
-
192
-
193
-
194
-
195
-
196
-
197
-
198
-
199
-
200
-
201
-
202
-
203
-
204
-
205
-
206
-
207
-
208
-
209
-
210
-
211
-
212
-
213
-
214
-
215
-
216
-
217
-
218
-
219
-
220
-
221
-
222
-
223
-
224
-
225
-
226
-
227
-
228
-
229
-
230
-
231
-
232
-
233
-
234
-
235
-
236
-
237
-
238
-
239
-
240
-
241
-
242
-
243
-
244
-
245
-
246
-
247
-
248
-
249
-
250
-
251
-
252
-
253
-
254
-
255
-
256
-
257
-
258
-
259
-
260
-
261
-
262
-
263
-
264
-
265
-
266
-
267
-
268
-
269
-
270
-
271
-
272
-
273
-
274
-
275
-
276
-
277
-
278
-
279
-
280
-
281
-
282
-
283
-
284
-
285
-
286
-
287
-
288
-
289
-
290
-
291
-
292
-
293
-
294
-
295
-
296
-
297
-
298
-
299
-
300
-
301
-
302
-
303
-
304
-
305
-
306
-
307
-
308
-
309
-
310
-
311
-
312
-
313
-
314
-
315
-
316
-
317
-
318
-
319
-
320
-
321
-
322
-
323
-
324
-
325
-
326
-
327
-
328
-
329
-
330
-
331
-
332
-
333
-
334
-
335
-
336
-
337
-
338
-
339
-
340
-
341
-
342
-
343
-
344
-
345
-
346
-
347
-
348
-
349
-
350
-
351
-
352
-
353
-
354
-
355
-
356
-
357
-
358
-
359
-
360
-
361
-
362
-
363
-
364
-
365
-
366
-
367
-
368
-
369
-
370
-
371
-
372
-
373
-
374
-
375
-
376
-
377
-
378
-
379
-
380
-
381
-
382
-
383
-
384
-
385
-
386
-
387
-
388
-
389
-
390
-
391
-
392
-
393
-
394
-
395
-
396
-
397
-
398
-
399
-
400
-
401
-
402
-
403
-
404
-
405
-
406
-
407
-
408
-
409
-
410
-
411
-
412
-
413
-
414
-
415
-
416
-
417
-
418
-
419
-
420
-
421
-
422
-
423
-
424
-
425
-
426
-
427
-
428
-
429
-
430
-
431
-
432
-
433
-
434
-
435
-
436
-
437
-
438
-
439
-
440
-
441
-
442
-
443
-
444
-
445
 |
 |

41RBS Group 2010
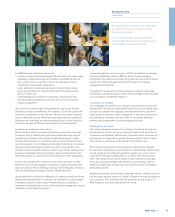
Divisional review
Non-Core Division
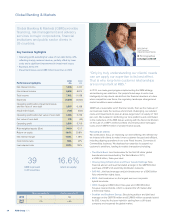
Asset Protection Scheme (APS)
Maximising shareholder value
We achieved a significant reduction in the division’s operating loss from
£14.6 billion in 2009 to £5.5 billion, largely due to improvements in income
from trading activities and lower impairments.
The active management of our market risk exposures helped to achieve
a significant improvement in income from trading activities, turning a £5.2
billion loss in 2009 into a £31 million loss in 2010. Our exposure to monoline
insurers has been managed down, while hedging and credit protection
helped to reduce day-to-day swings even when market volatility was high.
Impairments continued to fall, reflecting the reduction in assets and
improvements in the underlying quality of the remaining portfolio.
Impairments totalled £5.5 billion in 2010, down from £9.2 billion in 2009.
Taking risk ‘off the table’
We also concentrated on strengthening risk management, through
reducing risk exposures and responding to risks that emerge. In the
markets area, risk management has reduced the daily income
volatility of traded assets, helping to protect the Bank against sudden
market changes.
However, there was upward pressure on Risk Weighted Assets from pro-
cyclical increases in risk weights and from regulatory changes. Offsetting
this has been the progress achieved in asset disposals, run-offs and
strengthened risk management. As a result, RWAs have reduced from
£171 billion at the start of the year to £154 billion at year-end.
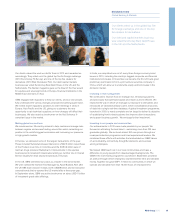
Looking ahead
The Non-Core Division is central to the strategy that will return RBS to
stand-alone strength. The encouraging progress made so far provides
a solid foundation for meeting the challenges ahead.
We are ahead of our plan and gathering momentum for the further work
ahead. We are confident that we have the team in place to continue to
deliver one of the largest corporate restructurings ever undertaken.
We passed the £100 billion milestone
in our journey, reducing third party assets
to £138 billion at year-end.
We continue to target an exit from the
APS within the last two years of the
Strategic Plan (2012-13), subject to
regulatory approval.
The APS is a key part of the UK government’s
measures to restore stability and confidence
in the banking sector. It provides RBS with
credit protection in the unlikely, though still
possible, event of a severe downturn in the
economy. RBS Group’s participation in the
APS is managed centrally within the
Restructuring & Risk area.
Following the agreement of the terms of the Scheme in December 2009,
we have enhanced and widened our training programme for staff and
have restructured our operating procedures to accommodate the
Scheme’s requirements. We continue to work closely with the Asset
Protection Agency (APA) with regard to the day-to-day stewardship of
assets covered by the Scheme.
It is our opinion that the APS continues to provide valuable support during
our restructuring, providing additional confidence to the market against
the backdrop of economic uncertainty. But we continue to target an exit
from the APS within the last two years of the Strategic Plan (2012-13),
subject to regulatory approval.
The amount of assets covered by the scheme has fallen from an initial
£282 billion to £195 billion at the end of 2010. We estimate, on the basis
of expected future recoveries, the expected loss on triggered assets at
31 December 2010 to be approximately £25 billion, equivalent to 42% of
the £60 billion first loss threshold under the APS. RBS does not currently
expect that losses on covered assets will exceed the first loss provision
over the lifetime of its participation in the Scheme.
Asset Protection Scheme (APS)
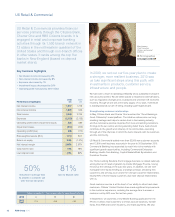
Rory Cullinan
Head of Non-Core Division