RBS 2010 Annual Report Download - page 70
Download and view the complete annual report
Please find page 70 of the 2010 RBS annual report below. You can navigate through the pages in the report by either clicking on the pages listed below, or by using the keyword search tool below to find specific information within the annual report.-
 1
1 -
2
-
3
-
4
-
5
-
6
-
7
-
8
-
9
-
10
-
11
-
12
-
13
-
14
-
15
-
16
-
17
-
18
-
19
-
20
-
21
-
22
-
23
-
24
-
25
-
26
-
27
-
28
-
29
-
30
-
31
-
32
-
33
-
34
-
35
-
36
-
37
-
38
-
39
-
40
-
41
-
42
-
43
-
44
-
45
-
46
-
47
-
48
-
49
-
50
-
51
-
52
-
53
-
54
-
55
-
56
-
57
-
58
-
59
-
 60
60 -
 61
61 -
 62
62 -
 63
63 -
 64
64 -
 65
65 -
 66
66 -
 67
67 -
 68
68 -
 69
69 -
 70
70 -
 71
71 -
 72
72 -
 73
73 -
 74
74 -
 75
75 -
 76
76 -
 77
77 -
 78
78 -
 79
79 -
 80
80 -
81
-
82
-
83
-
84
-
85
-
86
-
87
-
88
-
89
-
90
-
91
-
92
-
93
-
94
-
95
-
96
-
97
-
98
-
99
-
100
-
101
-
102
-
103
-
104
-
105
-
106
-
107
-
108
-
109
-
110
-
111
-
112
-
113
-
114
-
115
-
116
-
117
-
118
-
119
-
120
-
121
-
122
-
123
-
124
-
125
-
126
-
127
-
128
-
129
-
130
-
131
-
132
-
133
-
134
-
135
-
136
-
137
-
138
-
139
-
140
-
141
-
142
-
143
-
144
-
145
-
146
-
147
-
148
-
149
-
150
-
151
-
152
-
153
-
154
-
155
-
156
-
157
-
158
-
159
-
160
-
161
-
162
-
163
-
164
-
165
-
166
-
167
-
168
-
169
-
170
-
171
-
172
-
173
-
174
-
175
-
176
-
177
-
178
-
179
-
180
-
181
-
182
-
183
-
184
-
185
-
186
-
187
-
188
-
189
-
190
-
191
-
192
-
193
-
194
-
195
-
196
-
197
-
198
-
199
-
200
-
201
-
202
-
203
-
204
-
205
-
206
-
207
-
208
-
209
-
210
-
211
-
212
-
213
-
214
-
215
-
216
-
217
-
218
-
219
-
220
-
221
-
222
-
223
-
224
-
225
-
226
-
227
-
228
-
229
-
230
-
231
-
232
-
233
-
234
-
235
-
236
-
237
-
238
-
239
-
240
-
241
-
242
-
243
-
244
-
245
-
246
-
247
-
248
-
249
-
250
-
251
-
252
-
253
-
254
-
255
-
256
-
257
-
258
-
259
-
260
-
261
-
262
-
263
-
264
-
265
-
266
-
267
-
268
-
269
-
270
-
271
-
272
-
273
-
274
-
275
-
276
-
277
-
278
-
279
-
280
-
281
-
282
-
283
-
284
-
285
-
286
-
287
-
288
-
289
-
290
-
291
-
292
-
293
-
294
-
295
-
296
-
297
-
298
-
299
-
300
-
301
-
302
-
303
-
304
-
305
-
306
-
307
-
308
-
309
-
310
-
311
-
312
-
313
-
314
-
315
-
316
-
317
-
318
-
319
-
320
-
321
-
322
-
323
-
324
-
325
-
326
-
327
-
328
-
329
-
330
-
331
-
332
-
333
-
334
-
335
-
336
-
337
-
338
-
339
-
340
-
341
-
342
-
343
-
344
-
345
-
346
-
347
-
348
-
349
-
350
-
351
-
352
-
353
-
354
-
355
-
356
-
357
-
358
-
359
-
360
-
361
-
362
-
363
-
364
-
365
-
366
-
367
-
368
-
369
-
370
-
371
-
372
-
373
-
374
-
375
-
376
-
377
-
378
-
379
-
380
-
381
-
382
-
383
-
384
-
385
-
386
-
387
-
388
-
389
-
390
-
391
-
392
-
393
-
394
-
395
-
396
-
397
-
398
-
399
-
400
-
401
-
402
-
403
-
404
-
405
-
406
-
407
-
408
-
409
-
410
-
411
-
412
-
413
-
414
-
415
-
416
-
417
-
418
-
419
-
420
-
421
-
422
-
423
-
424
-
425
-
426
-
427
-
428
-
429
-
430
-
431
-
432
-
433
-
434
-
435
-
436
-
437
-
438
-
439
-
440
-
441
-
442
-
443
-
444
-
445
 |
 |

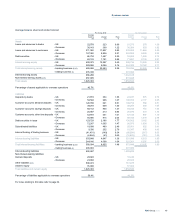
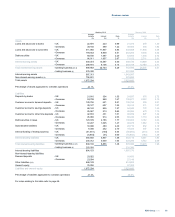
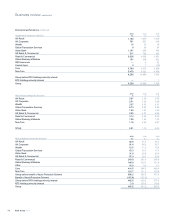
Analysis of change in net interest income - volume and rate analysis continued
2009 over 2008 - pro forma 2009 over 2008 - statutory
Increase/(decrease) due to changes in: Increase/(decrease) due to changes in:
Average
volume
Average
rate
Net
change
Average
volume
Average
rate
Net
change
£m £m £m £m £m £m
Interest-earning assets
Loans and advances to banks
UK 107 (807) (700) 110 (771) (661)
Overseas 83 (841) (758) 81 (841) (760)
Loans and advances to customers
UK 702 (7,923) (7,221) 710 (7,901) (7,191)
Overseas (1,751) (4,786) (6,537) (1,754) (4,783) (6,537)
Debt securities
UK 630 (843) (213) 604 (631) (27)
Overseas 646 (1,024) (378) (267) (786) (1,053)
Total interest receivable of the banking business
UK 1,439 (9,573) (8,134) 1,424 (9,303) (7,879)
Overseas (1,022) (6,651) (7,673) (1,940) (6,410) (8,350)
417 (16,224) (15,807) (516) (15,713) (16,229)
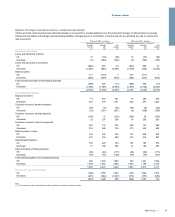
Interest-bearing liabilities
Deposits by banks
UK 588 244 832 635 348 983
Overseas 137 2,316 2,453 233 2,248 2,481
Customer accounts: demand deposits
UK (253) 2,488 2,235 (253) 2,488 2,235
Overseas (38) 302 264 (35) 305 270
Customer accounts: savings deposits
UK (359) 1,278 919 (359) 1,278 919
Overseas (70) 167 97 (71) 168 97
Customer accounts: other time deposits
UK 908 2,249 3,157 908 2,263 3,171
Overseas 994 814 1,808 1,326 863 2,189
Debt securities in issue
UK (651) 2,770 2,119 (691) 2,146 1,455
Overseas 414 2,666 3,080 751 2,746 3,497
Subordinated liabilities
UK 87 430 517 5 512 517
Overseas (106) 61 (45) 14 132 146
Internal funding of trading business
UK (795) (2,333) (3,128) (795) (2,333) (3,128)
Overseas (112) (426) (538) (112) (425) (537)
Total interest payable of the banking business
UK (475) 7,126 6,651 (550) 6,702 6,152
Overseas 1,219 5,900 7,119 2,106 6,037 8,143
744 13,026 13,770 1,556 12,739 14,295
Movement in net interest income
UK 964 (2,447) (1,483) 874 (2,601) (1,727)
Overseas 197 (751) (554) 166 (373) (207)
1,161 (3,198) (2,037) 1,040 (2,974) (1,934)
Note:
(1) The analysis into UK and Overseas has been compiled on the basis of location of office.
RBS Group 201068
Business review continued