RBS 2010 Annual Report Download - page 187
Download and view the complete annual report
Please find page 187 of the 2010 RBS annual report below. You can navigate through the pages in the report by either clicking on the pages listed below, or by using the keyword search tool below to find specific information within the annual report.-
 1
1 -
2
-
3
-
4
-
5
-
6
-
7
-
8
-
9
-
10
-
11
-
12
-
13
-
14
-
15
-
16
-
17
-
18
-
19
-
20
-
21
-
22
-
23
-
24
-
25
-
26
-
27
-
28
-
29
-
30
-
31
-
32
-
33
-
34
-
35
-
36
-
37
-
38
-
39
-
40
-
41
-
42
-
43
-
44
-
45
-
46
-
47
-
48
-
49
-
50
-
51
-
52
-
53
-
54
-
55
-
56
-
57
-
58
-
59
-
60
-
61
-
62
-
63
-
64
-
65
-
66
-
67
-
68
-
69
-
70
-
71
-
72
-
73
-
74
-
75
-
76
-
77
-
78
-
79
-
80
-
81
-
82
-
83
-
84
-
85
-
86
-
87
-
88
-
89
-
90
-
91
-
92
-
93
-
94
-
95
-
96
-
97
-
98
-
99
-
100
-
101
-
102
-
103
-
104
-
105
-
106
-
107
-
108
-
109
-
110
-
111
-
112
-
113
-
114
-
115
-
116
-
117
-
118
-
119
-
120
-
121
-
122
-
123
-
124
-
125
-
126
-
127
-
128
-
129
-
130
-
131
-
132
-
133
-
134
-
135
-
136
-
137
-
138
-
139
-
140
-
141
-
142
-
143
-
144
-
145
-
146
-
147
-
148
-
149
-
150
-
151
-
152
-
153
-
154
-
155
-
156
-
157
-
158
-
159
-
160
-
161
-
162
-
163
-
164
-
165
-
166
-
167
-
168
-
169
-
170
-
171
-
172
-
173
-
174
-
175
-
176
-
 177
177 -
 178
178 -
 179
179 -
 180
180 -
 181
181 -
 182
182 -
 183
183 -
 184
184 -
 185
185 -
 186
186 -
 187
187 -
 188
188 -
 189
189 -
 190
190 -
 191
191 -
 192
192 -
 193
193 -
 194
194 -
 195
195 -
 196
196 -
 197
197 -
198
-
199
-
200
-
201
-
202
-
203
-
204
-
205
-
206
-
207
-
208
-
209
-
210
-
211
-
212
-
213
-
214
-
215
-
216
-
217
-
218
-
219
-
220
-
221
-
222
-
223
-
224
-
225
-
226
-
227
-
228
-
229
-
230
-
231
-
232
-
233
-
234
-
235
-
236
-
237
-
238
-
239
-
240
-
241
-
242
-
243
-
244
-
245
-
246
-
247
-
248
-
249
-
250
-
251
-
252
-
253
-
254
-
255
-
256
-
257
-
258
-
259
-
260
-
261
-
262
-
263
-
264
-
265
-
266
-
267
-
268
-
269
-
270
-
271
-
272
-
273
-
274
-
275
-
276
-
277
-
278
-
279
-
280
-
281
-
282
-
283
-
284
-
285
-
286
-
287
-
288
-
289
-
290
-
291
-
292
-
293
-
294
-
295
-
296
-
297
-
298
-
299
-
300
-
301
-
302
-
303
-
304
-
305
-
306
-
307
-
308
-
309
-
310
-
311
-
312
-
313
-
314
-
315
-
316
-
317
-
318
-
319
-
320
-
321
-
322
-
323
-
324
-
325
-
326
-
327
-
328
-
329
-
330
-
331
-
332
-
333
-
334
-
335
-
336
-
337
-
338
-
339
-
340
-
341
-
342
-
343
-
344
-
345
-
346
-
347
-
348
-
349
-
350
-
351
-
352
-
353
-
354
-
355
-
356
-
357
-
358
-
359
-
360
-
361
-
362
-
363
-
364
-
365
-
366
-
367
-
368
-
369
-
370
-
371
-
372
-
373
-
374
-
375
-
376
-
377
-
378
-
379
-
380
-
381
-
382
-
383
-
384
-
385
-
386
-
387
-
388
-
389
-
390
-
391
-
392
-
393
-
394
-
395
-
396
-
397
-
398
-
399
-
400
-
401
-
402
-
403
-
404
-
405
-
406
-
407
-
408
-
409
-
410
-
411
-
412
-
413
-
414
-
415
-
416
-
417
-
418
-
419
-
420
-
421
-
422
-
423
-
424
-
425
-
426
-
427
-
428
-
429
-
430
-
431
-
432
-
433
-
434
-
435
-
436
-
437
-
438
-
439
-
440
-
441
-
442
-
443
-
444
-
445
 |
 |

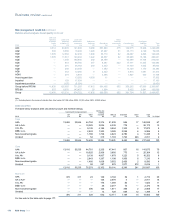
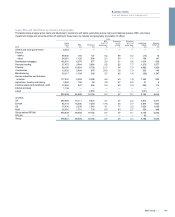
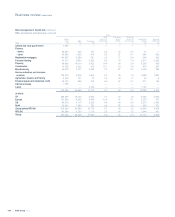
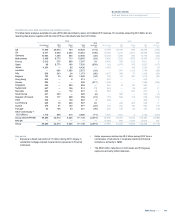
Core
2010
Gross
loans
£m
REIL
£m
Provisions
£m
REIL
as a % of
gross loans
%
Provisions
as a %
of REIL
%
Provisions
as a % of
gross loans
%
Impairment
charge
£m
Amounts
written-off
£m
Central and local government 6,781 — — — — — — —
Finance
-banks 57,033 144 126 0.3 88 0.2 (5) 1
- other 46,910 567 402 1.2 71 0.9 191 53
Residential mortgages 140,359 3,999 693 2.8 17 0.5 578 243
Personal lending 33,581 3,131 2,545 9.3 81 7.6 1,157 1,271
Property 42,455 3,287 818 7.7 25 1.9 739 98
Construction 8,680 610 222 7.0 36 2.6 189 38
Manufacturing 25,797 555 266 2.2 48 1.0 119 124
Service industries and business
activities 95,127 2,576 948 2.7 37 1.0 687 349
Agriculture, forestry and fishing 3,758 94 57 2.5 61 1.5 24 5
Finance leases and instalment credit 8,321 244 140 2.9 57 1.7 63 42
Interest accruals 831 — — — — — — —
Latent — — 1,649 — — — (5) —
469,633 15,207 7,866 3.2 52 1.7 3,737 2,224
of which:
UK 319,679 9,337 4,797 2.9 51 1.5 2,234 1,519
Europe 65,874 3,905 2,027 5.9 52 3.1 936 111
US 62,085 1,027 824 1.7 80 1.3 425 556
RoW 21,995 938 218 4.3 23 1.0 142 38
Group before RFS MI 469,633 15,207 7,866 3.2 52 1.7 3,737 2,224
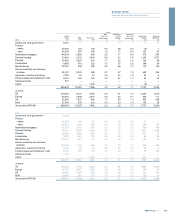
2009
Central and local government 6,128 — — — — — — —
Finance
-banks 47,574 168 135 0.4 80 0.3 12 —
- other 50,673 1,038 259 2.0 25 0.5 256 113
Residential mortgages 127,975 2,670 341 2.1 13 0.3 305 146
Personal lending 35,313 3,344 2,560 9.5 77 7.2 1,816 1,398
Property 49,054 1,766 468 3.6 27 1.0 417 37
Construction 9,502 457 131 4.8 29 1.4 58 30
Manufacturing 30,272 491 191 1.6 39 0.6 136 93
Service industries and business
activities 100,438 1,762 669 1.8 38 0.7 500 365
Agriculture, forestry and fishing 3,726 90 46 2.4 51 1.2 24 4
Finance leases and instalment credit 8,147 303 116 3.7 38 1.4 52 100
Interest accruals 1,179 — — — — — — —
Latent — — 2,005 — — — 991 —
469,981 12,089 6,921 2.6 57 1.5 4,567 2,286
of which:
UK 315,254 7,704 4,209 2.4 55 1.3 2,884 1,645
Europe 66,707 2,607 1,709 3.9 66 2.6 750 46
US 64,526 1,497 876 2.3 59 1.4 813 576
RoW 23,494 281 127 1.2 45 0.5 120 19
Group before RFS MI 469,981 12,089 6,921 2.6 57 1.5 4,567 2,286
185RBS Group 2010
Business review
Risk and balance sheet management